Gender Equity Data Analysis – Amount of CIHR Funding by Gender (Foundation Grant)
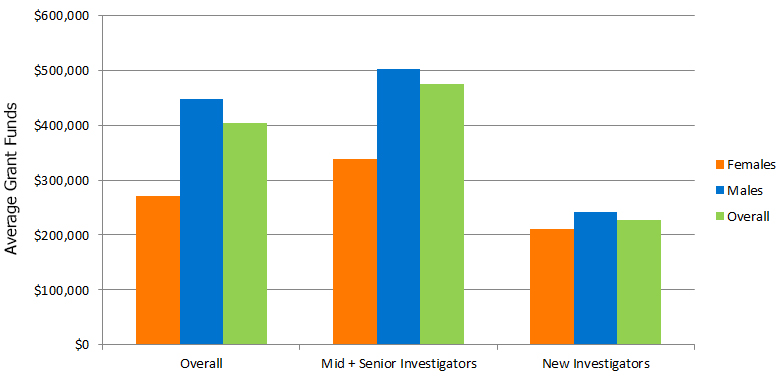
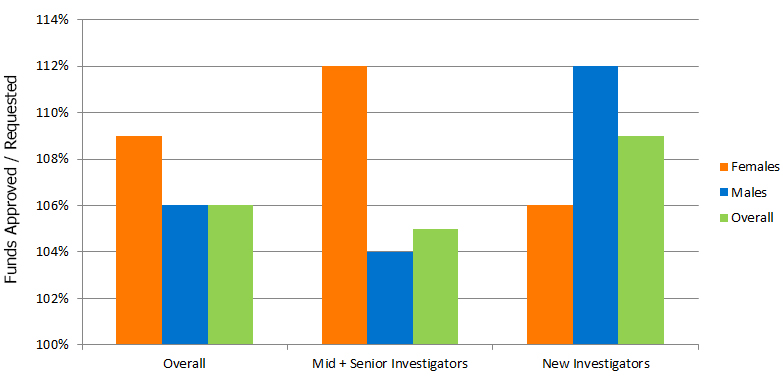
Methods: The data in this section represents the competition results of CIHR’s 2015/16 Foundation grant competition. The data are organized into graphs representing (A.) the average amount of funding received per year by gender ("Amount of CIHR Funding") and (B.) the percent of requested amount that was received, or the amount approved over amount requested ("Percent of Requested CIHR Funding").
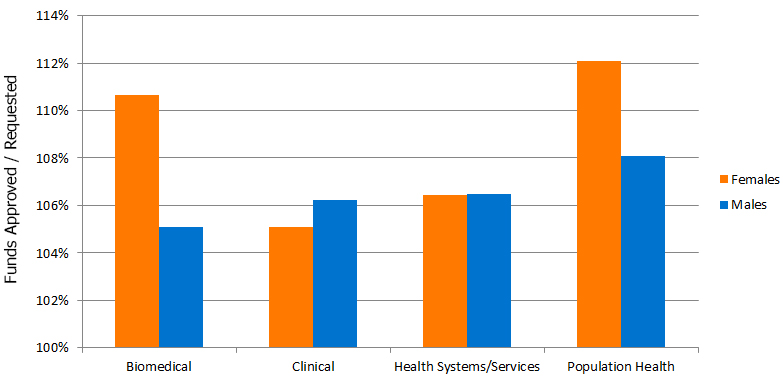
NB: The percent of requested CIHR funding was calculated using the baseline amount that CIHR calculated for each applicant as the "amount requested". Applicants were told that if they could justify a budget increase over their calculated baseline, they may be awarded an increase. For this reason, the % requested tended to exceed 100% because the amount awarded was often greater than the calculated baseline amount.
CIHR's 2015/16 Foundation Grant Program
A.

Long description
| Females | Males | Overall | |
|---|---|---|---|
| Overall | 270,295.38 | 448,079.55 | 404,792.97 |
| Mid + Senior Investigators | 338,674.41 | 501,768.38 | 475,912.02 |
| New Investigators | 211,033.56 | 242,272.33 | 228,072.89 |
B.

Long description
| Females | Males | Overall | |
|---|---|---|---|
| Overall | 109 | 106 | 106 |
| Mid + Senior Investigators | 112 | 104 | 105 |
| New Investigators | 106 | 112 | 109 |
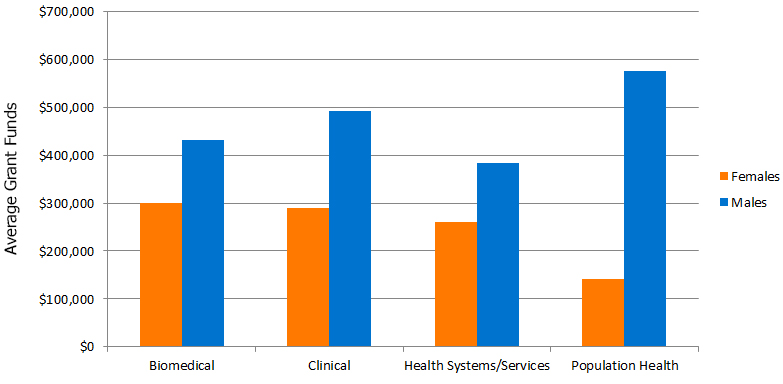
Average Approved Grant Size by Pillar
A.

Long description
| Females | Males | |
|---|---|---|
| Biomedical | 300,761.44 | 431,793.32 |
| Clinical | 289,595.97 | 491,495.99 |
| Health Systems/Services | 259,474.23 | 383,577.89 |
| Social Cultural, Environmental and Population Health Research | 141,398.11 | 576,469.94 |
B.

Long description
| Females | Males | |
|---|---|---|
| Biomedical | 111 | 105 |
| Clinical | 105 | 106 |
| Health Systems/Services | 106 | 106 |
| Social Cultural, Environmental and Population Health Research | 112 | 108 |
- Date modified: