Equity, Diversity and Inclusion in CIHR Funding Programs
2018 and 2019 Spring and Fall Project Grant Competitions
In May 2018, CIHR, along with the other federal funding agencies, launched a Tri-Agency self-identification Equity and Diversity Questionnaire for applicants to all funding competitions. The collection of this data marked an important first step in enabling CIHR to identify and understand potential inequities, underrepresentation or exclusions within our funding system.
The version of the survey used for the 2018 and 2019 Spring and Fall Project Grant competitions collected data on age, gender, and whether applicants identify as Indigenous, a visible minority or a person with a disability. We are pleased to share an overview of self-identification data for these competitions. While these limited data points do not allow for analyses of trends over time, we are committed to closely monitoring new data moving forward and working with the community to find solutions to address identified inequities.
Methods
The data in this section represent the self-identification questionnaire responses submitted by Nominated Principal Investigators from the Spring and Fall 2018 and 2019 Project Grant Competitions.Footnote 1
Career stage: Classification of early career researchers (ECRs) was self-reported and verified by CIHR’s Contact Centre.
Application rate: Calculated as the percentage of applicants who self-identified as part of a group. For example, if there were 10,000 applicants and 1,000 self-identified as “Woman,” the application rate would be 10%. Success rates were not calculated for groups with application rates of less than 1%.
Success rate: Calculated as the percentage of applicants from a group who were awarded a grant. For example, if 1,000 applicants self-identified as “Woman” and 100 were successful, the success rate for women would be calculated as 10%.
Proportion of successful applicants: Calculated as the percentage of successful grant holders who self-identified as part of a group. For example, if there were 1,000 successful grant holders and 500 self-identified as “Woman”, the proportion of successful applicants for women would be 50%. If the proportion of successful applicants for a group was calculated to be less than 1%, their data were not reported.
Important notes
The self-identification questionnaire launched in May 2018. The limited data points presented here do not allow for analyses of trends over time, and as such, no statistical comparisons were conducted. The data presented here will be compared to data collected in future years.
Self-identified Indigenous person: Group sizes for application rate and the proportion of successful applicants were <1%, so no data is presented here.
Self-identified Gender-fluid, non-binary and/or Two-Spirit: Group sizes for application rate and the proportion of successful applicants were <1%, so no data is presented here.
Self-identified visible minority
Figure 1: Application rates by self-identified visible minority
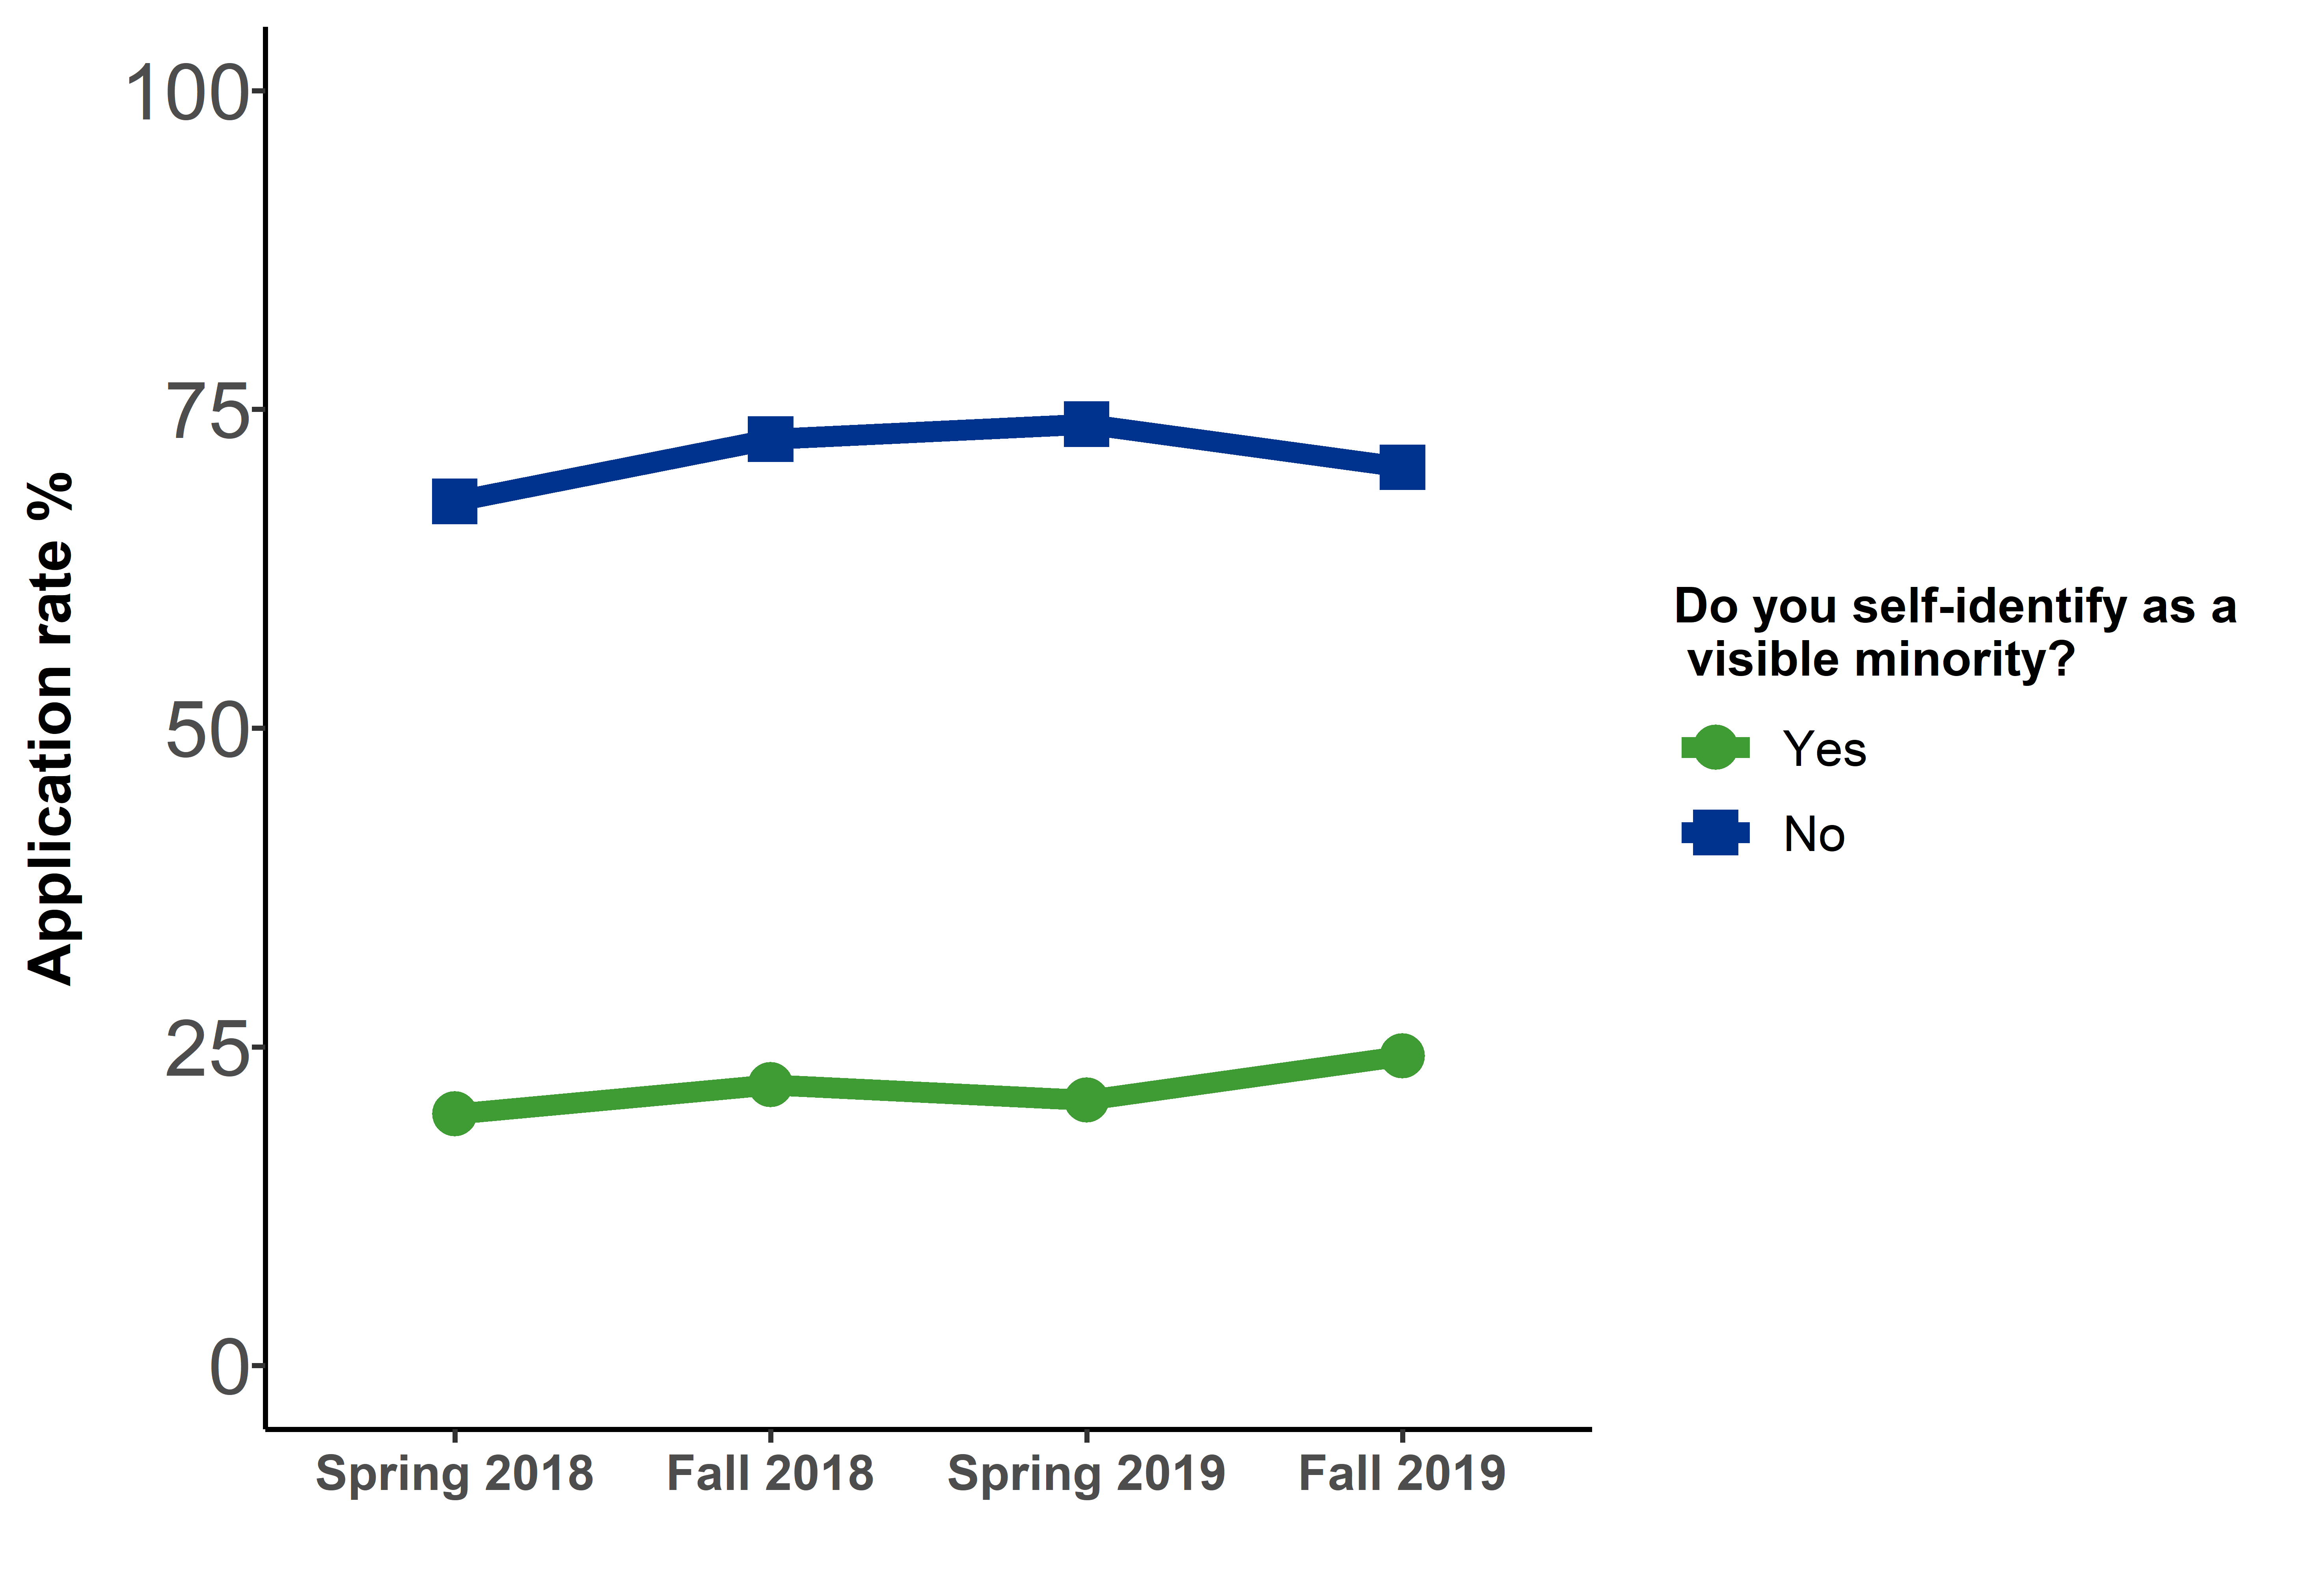
Figure 1 long description
| Response | Spring 2018 | Fall 2018 | Spring 2019 | Fall 2019 |
|---|---|---|---|---|
| Yes | 19.7% | 22% | 20.8% | 24.3% |
| No | 67.8% | 72.7% | 73.8% | 70.5% |
| I prefer not to answer | 5.8% | 5.3% | 5.4% | 5.3% |
Figure 2: Proportion of successful applicants by self-identified visible minority
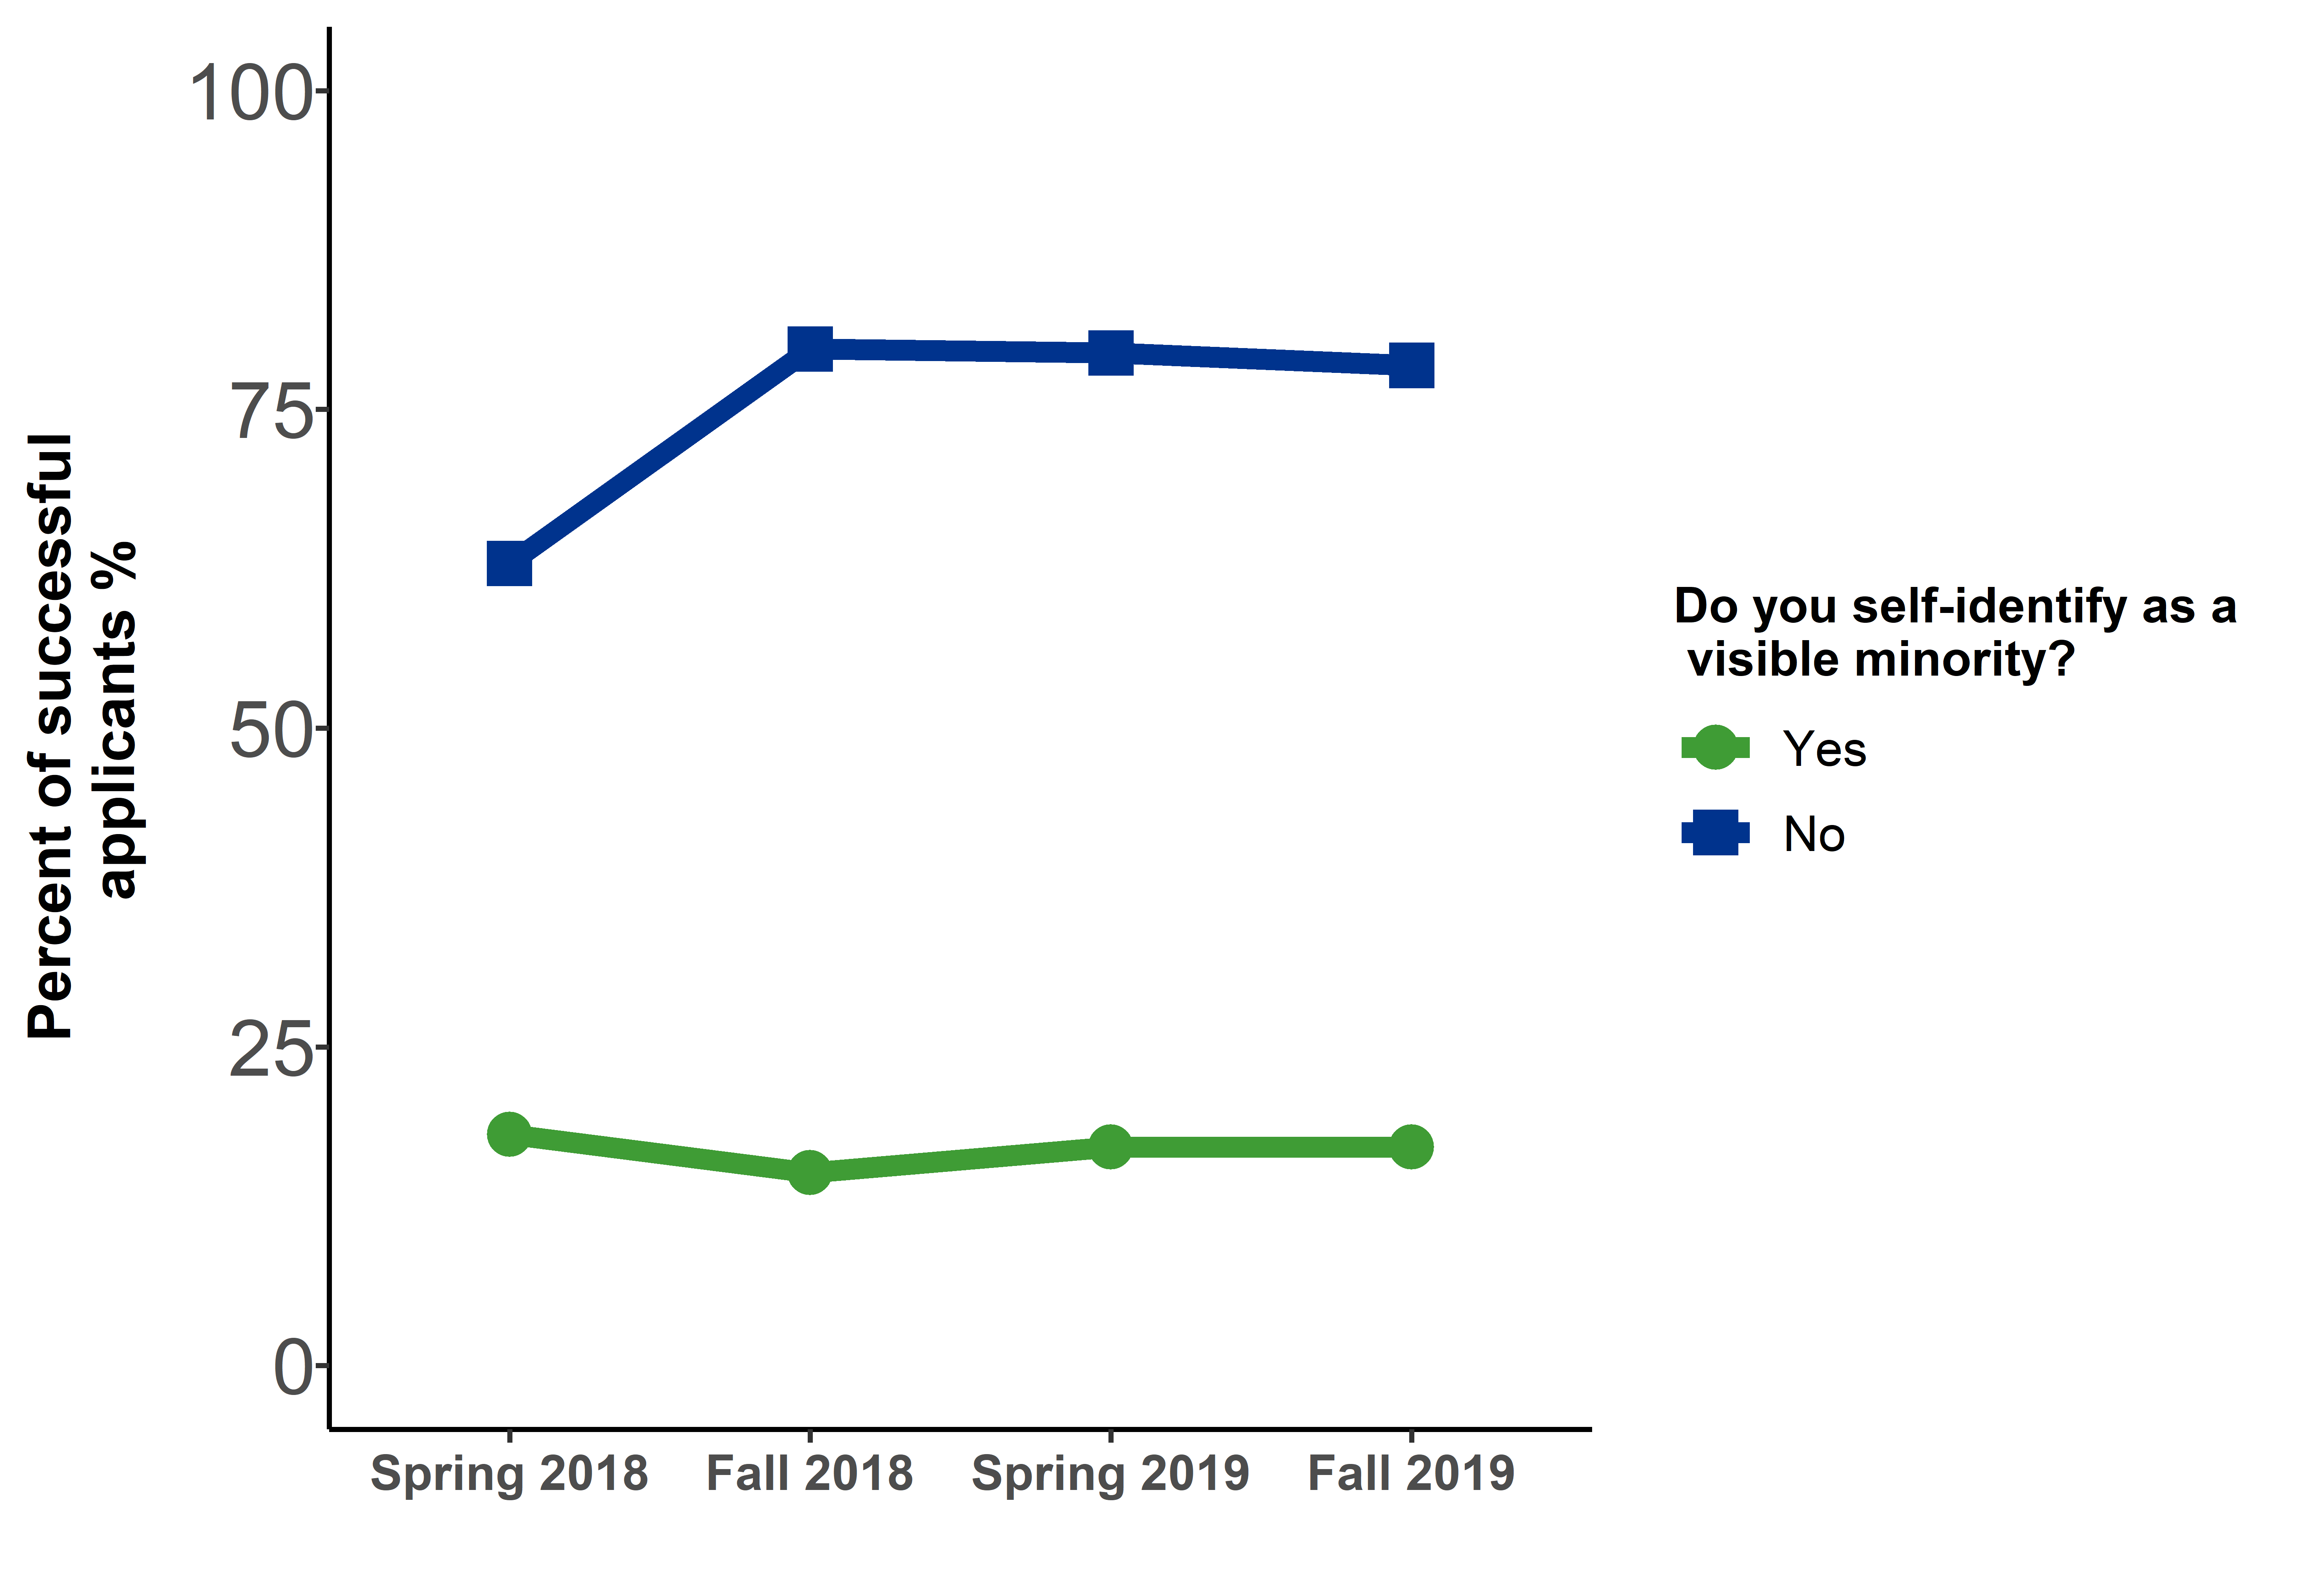
Figure 2 long description
| Response | Spring 2018 | Fall 2018 | Spring 2019 | Fall 2019 |
|---|---|---|---|---|
| Yes | 18.1% | 15.1% | 17.2% | 17.1% |
| No | 62.9% | 79.7% | 79.4% | 78.4% |
| I prefer not to answer | 5.8% | 5.1% | 3.4% | 4.4% |
Figure 3: Success rates by self‐identified visible minority
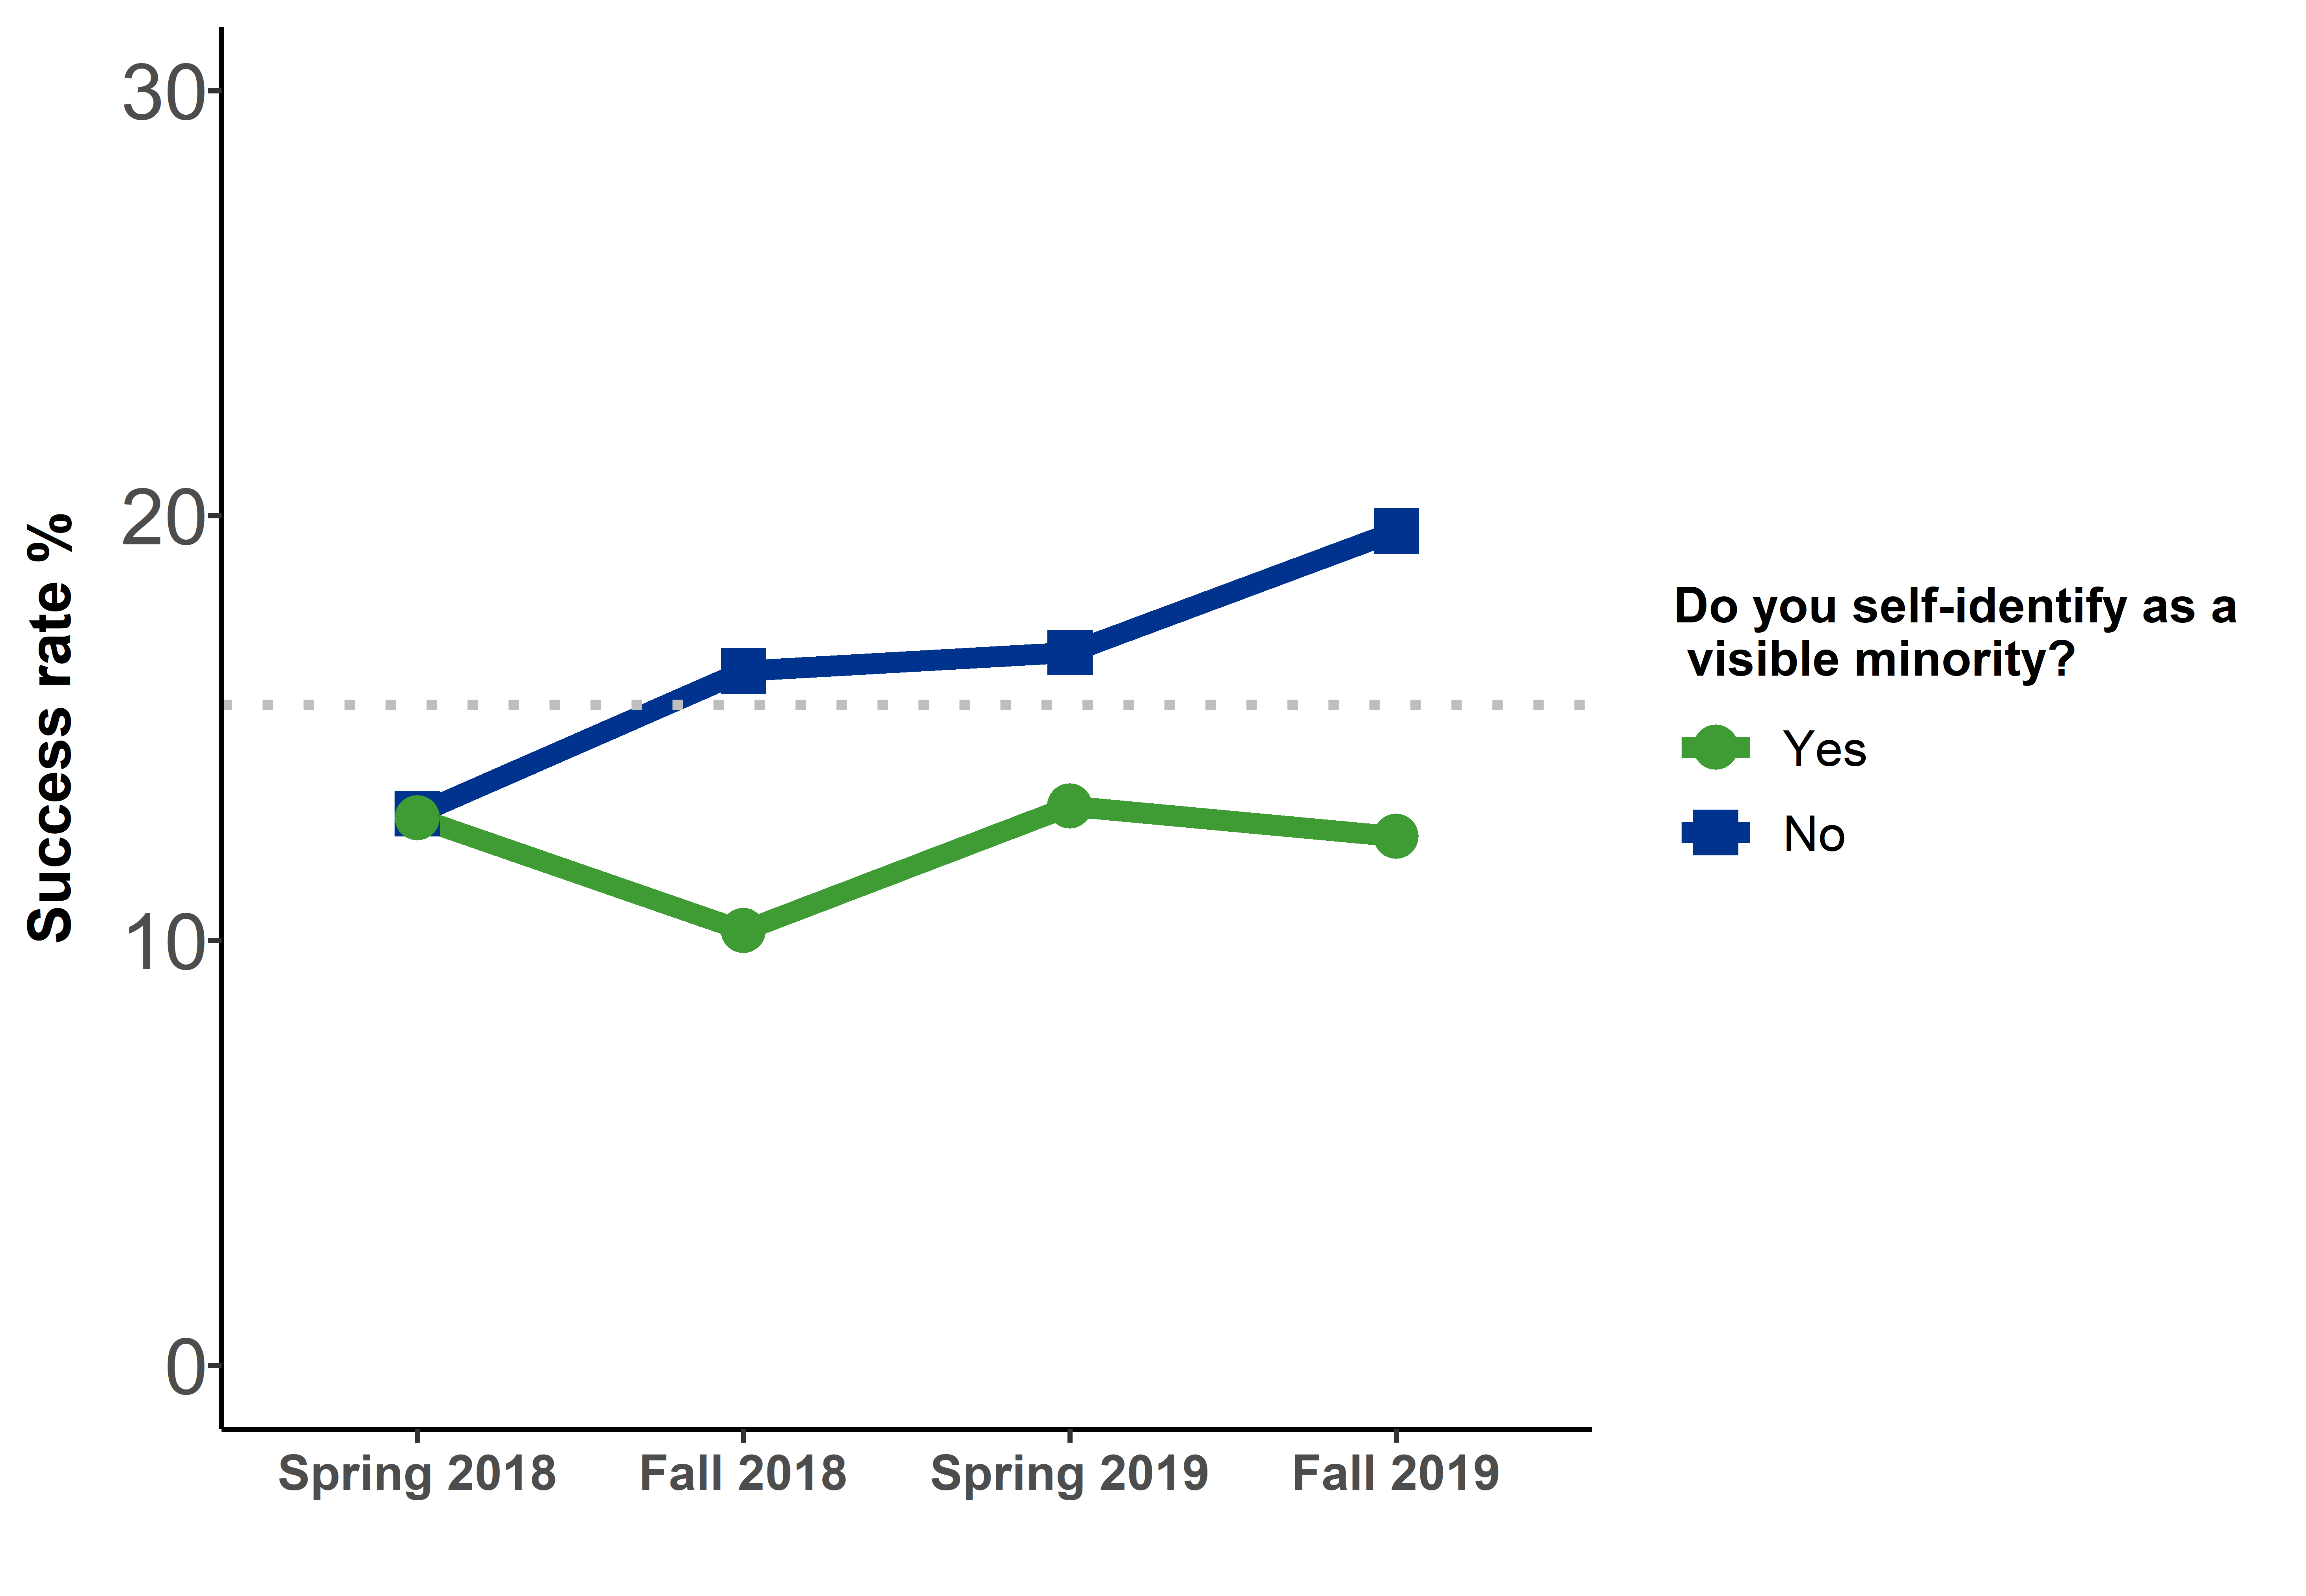
Grey dotted line represents the average success rate across these 4 competitions.
Figure 3 long description
| Response | Spring 2018 | Fall 2018 | Spring 2019 | Fall 2019 |
|---|---|---|---|---|
| Yes | 12.9% | 10.2% | 13.2% | 12.5% |
| No | 13% | 16.3% | 16.8% | 19.6% |
| I prefer not to answer | 13.6% | 15.2% | 9.9% | 14.8% |
Self-identified gender
Figure 4: Application rates by self-identified gender
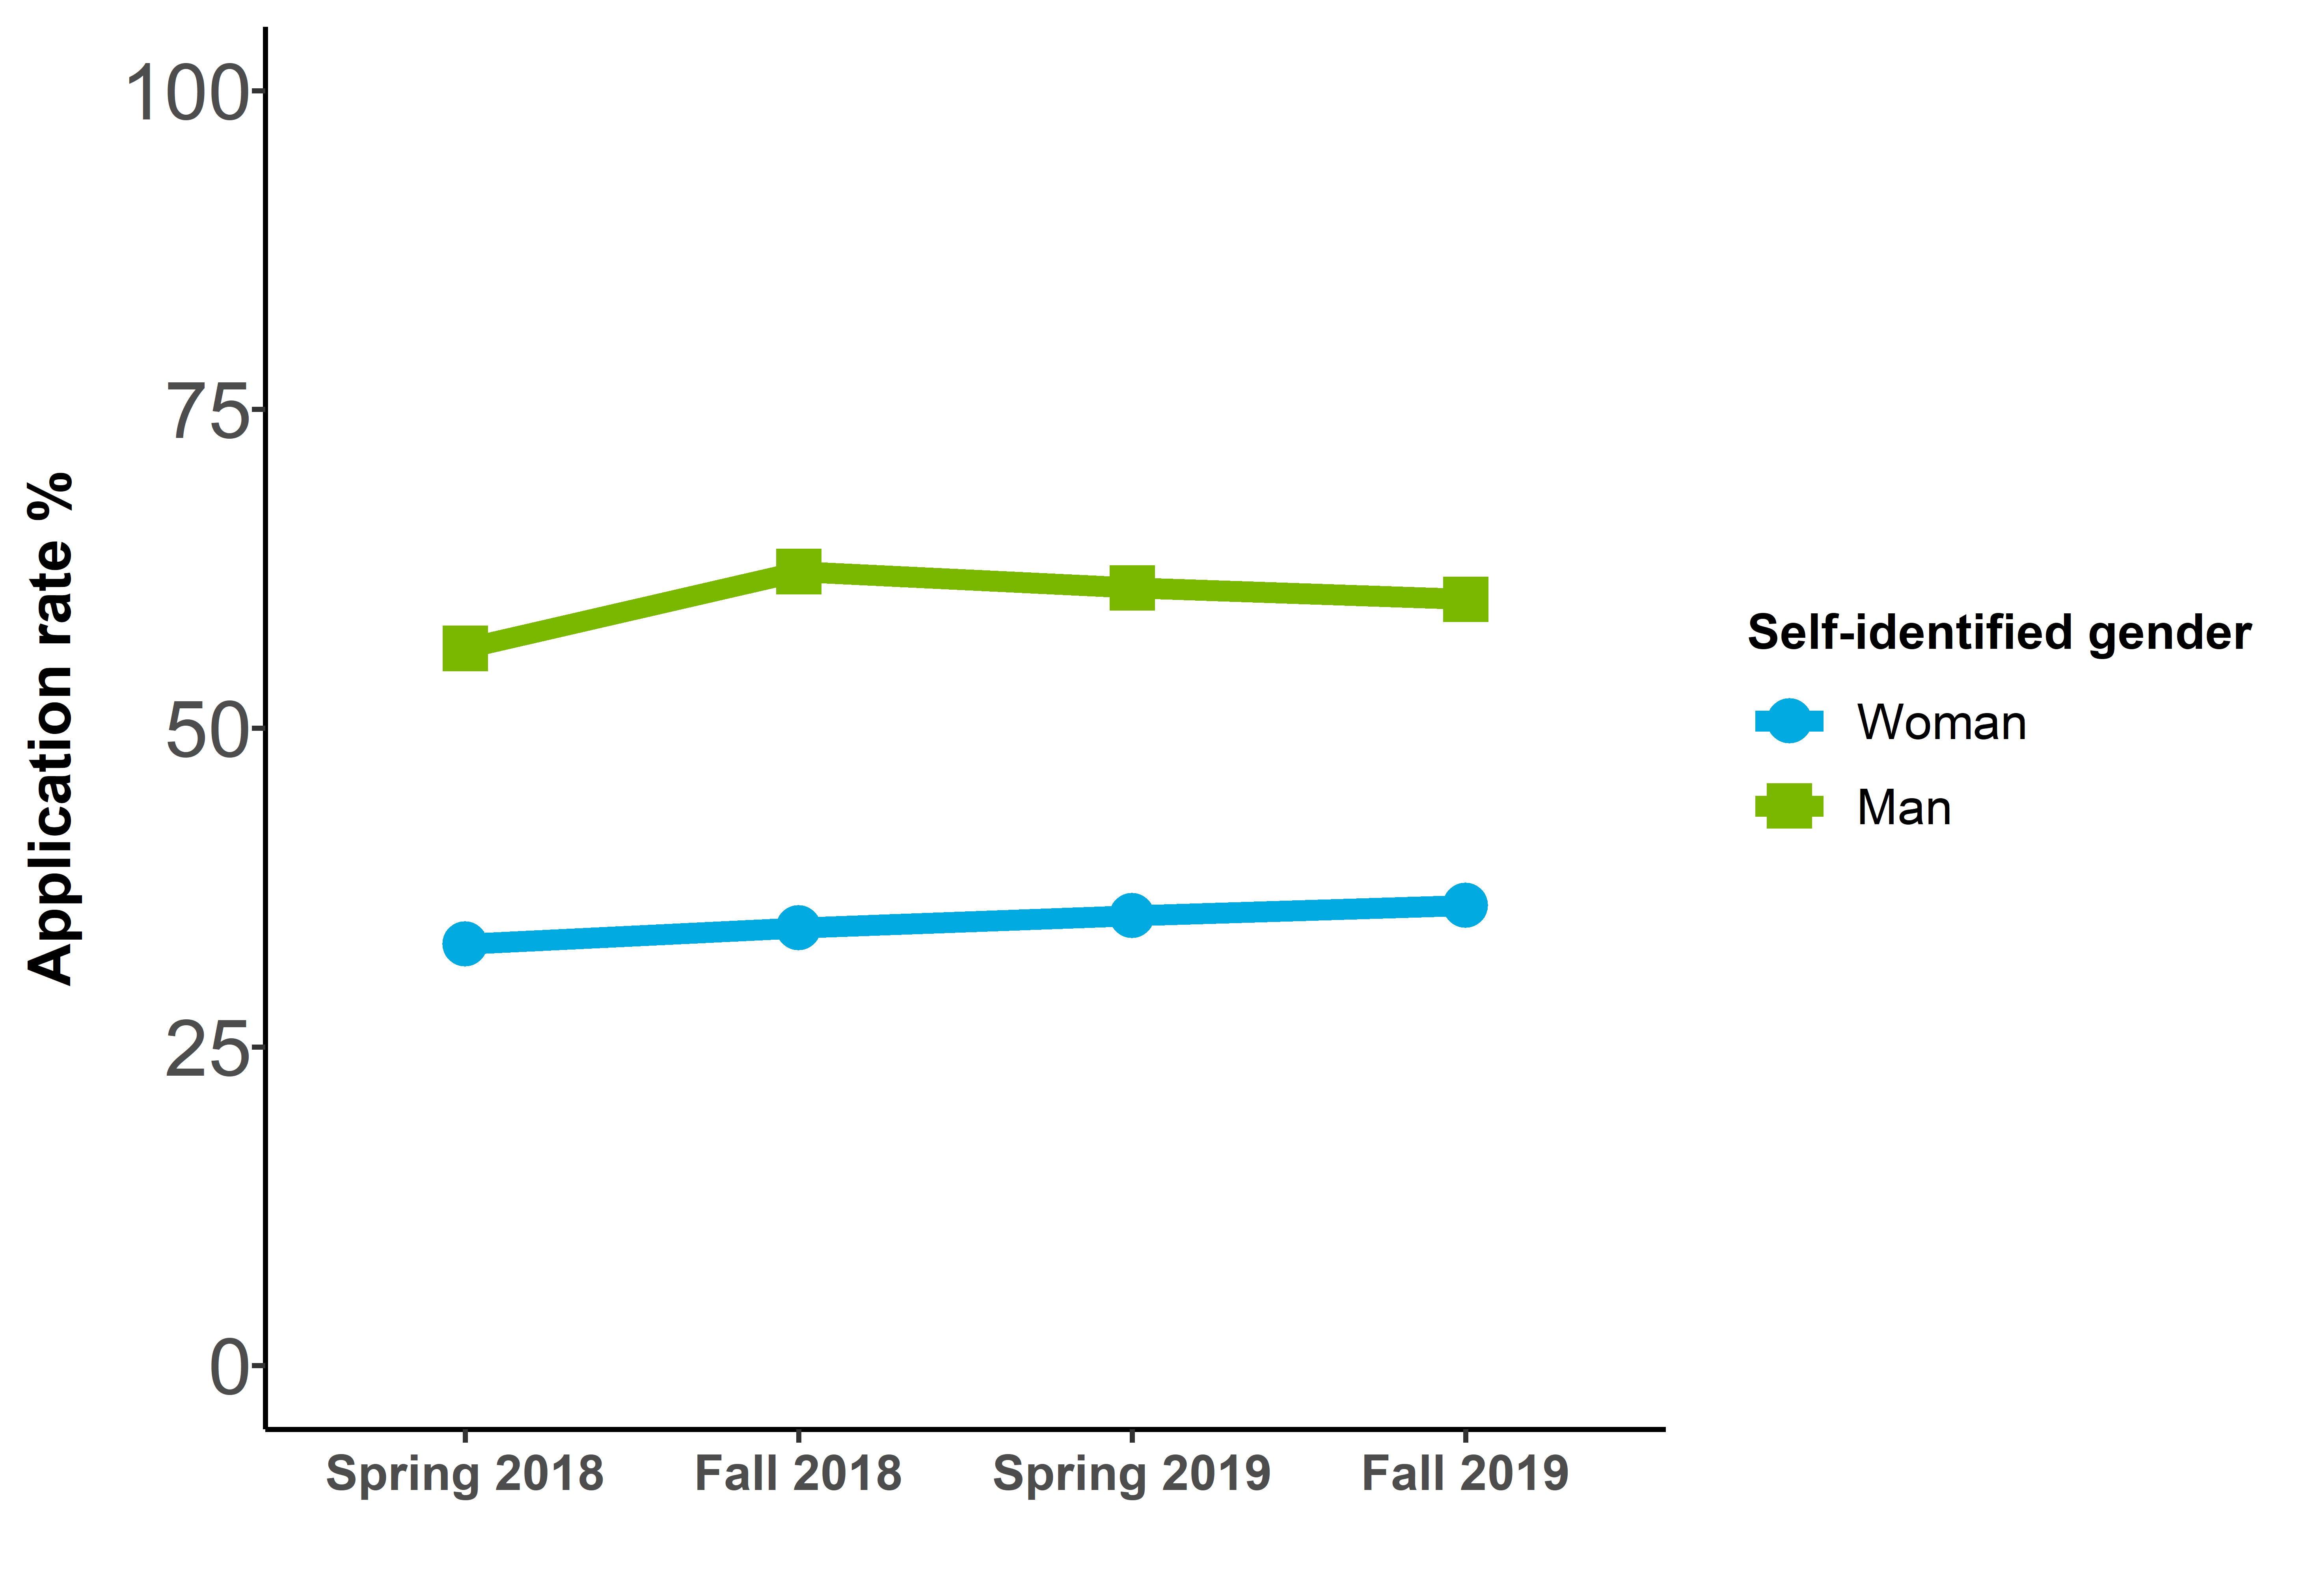
Note: less than 1% of applicants self-reported their gender identity as “Gender-fluid, non-binary and/or Two-Spirit”, and their data are not presented here.
Figure 4 long description
| Response | Spring 2018 | Fall 2018 | Spring 2019 | Fall 2019 |
|---|---|---|---|---|
| Woman | 33.1% | 34.3% | 35.3% | 36.1% |
| Man | 56.2% | 62.3% | 61% | 60.1% |
| I prefer not to answer | 13.6% | 15.2% | 9.9% | 14.8% |
Figure 5: Proportion of successful applicants by self-identified gender
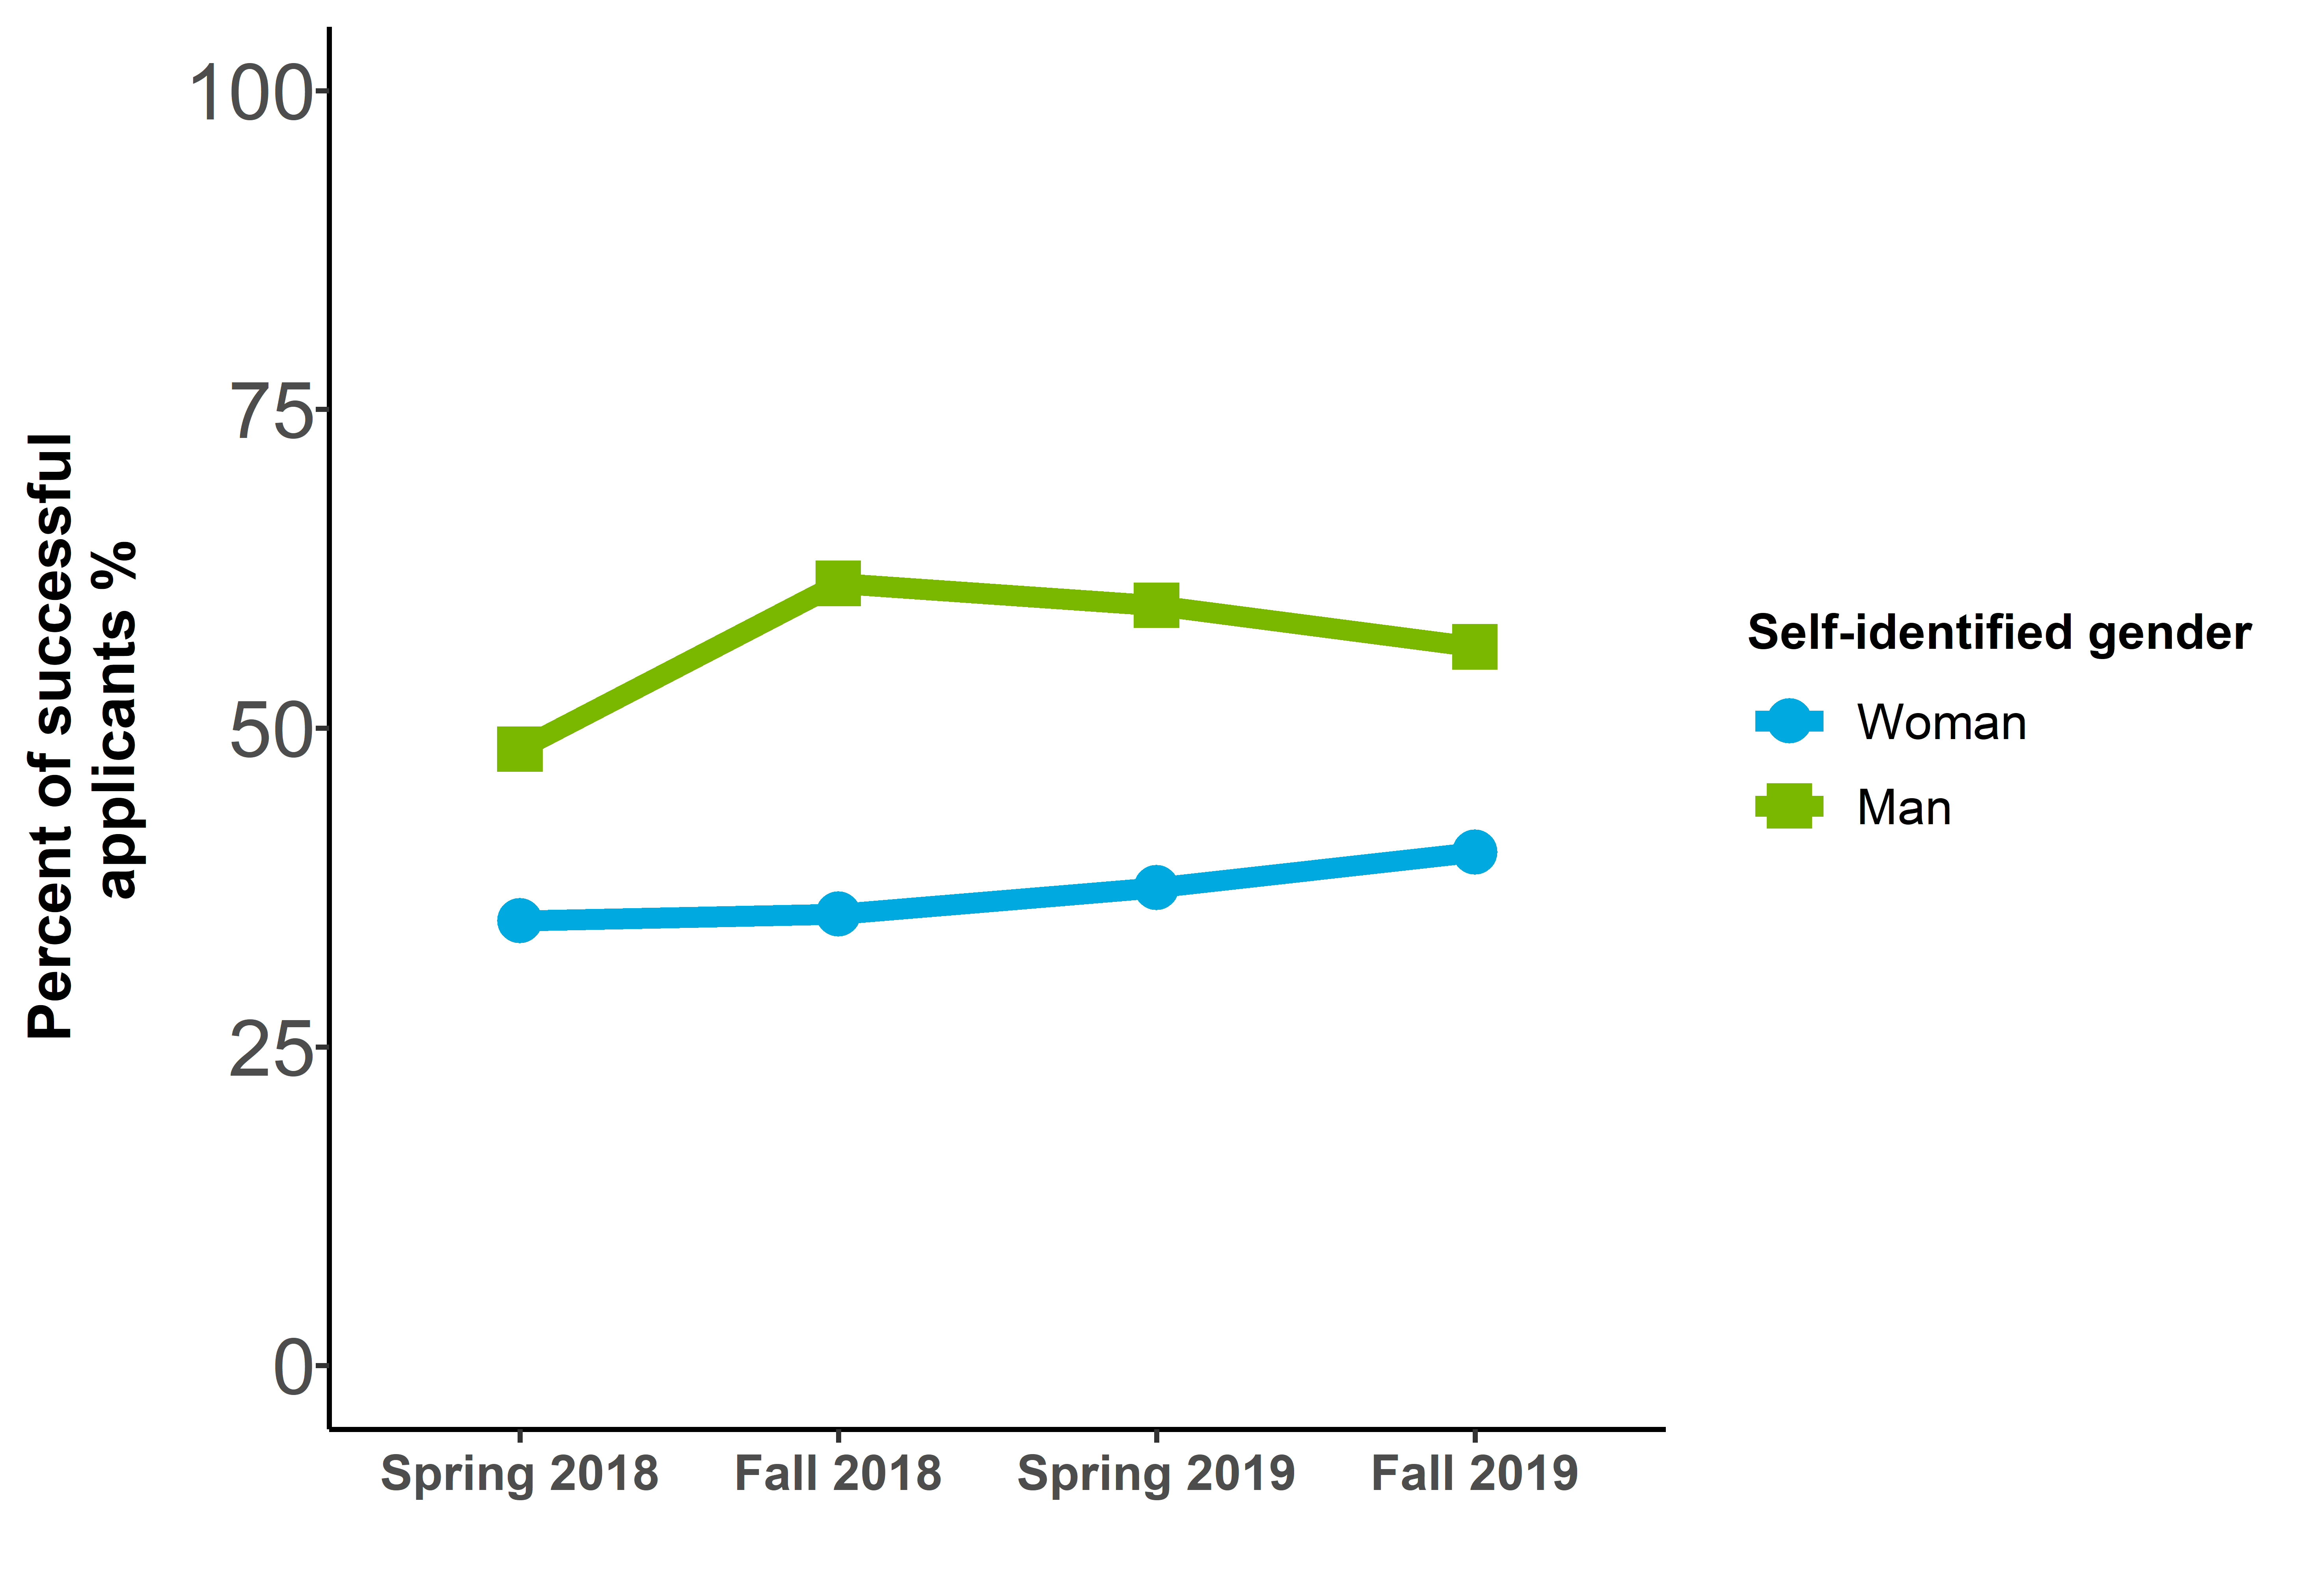
Figure 5 long description
| Response | Spring 2018 | Fall 2018 | Spring 2019 | Fall 2019 |
|---|---|---|---|---|
| Woman | 34.9% | 35.4% | 37.5% | 40.3% |
| Man | 48.4% | 61.4% | 59.6% | 56.4% |
| I prefer not to answer | 3.6% | 3% | 2.6% | 3.4% |
Figure 6: Success rates by self‐identified gender
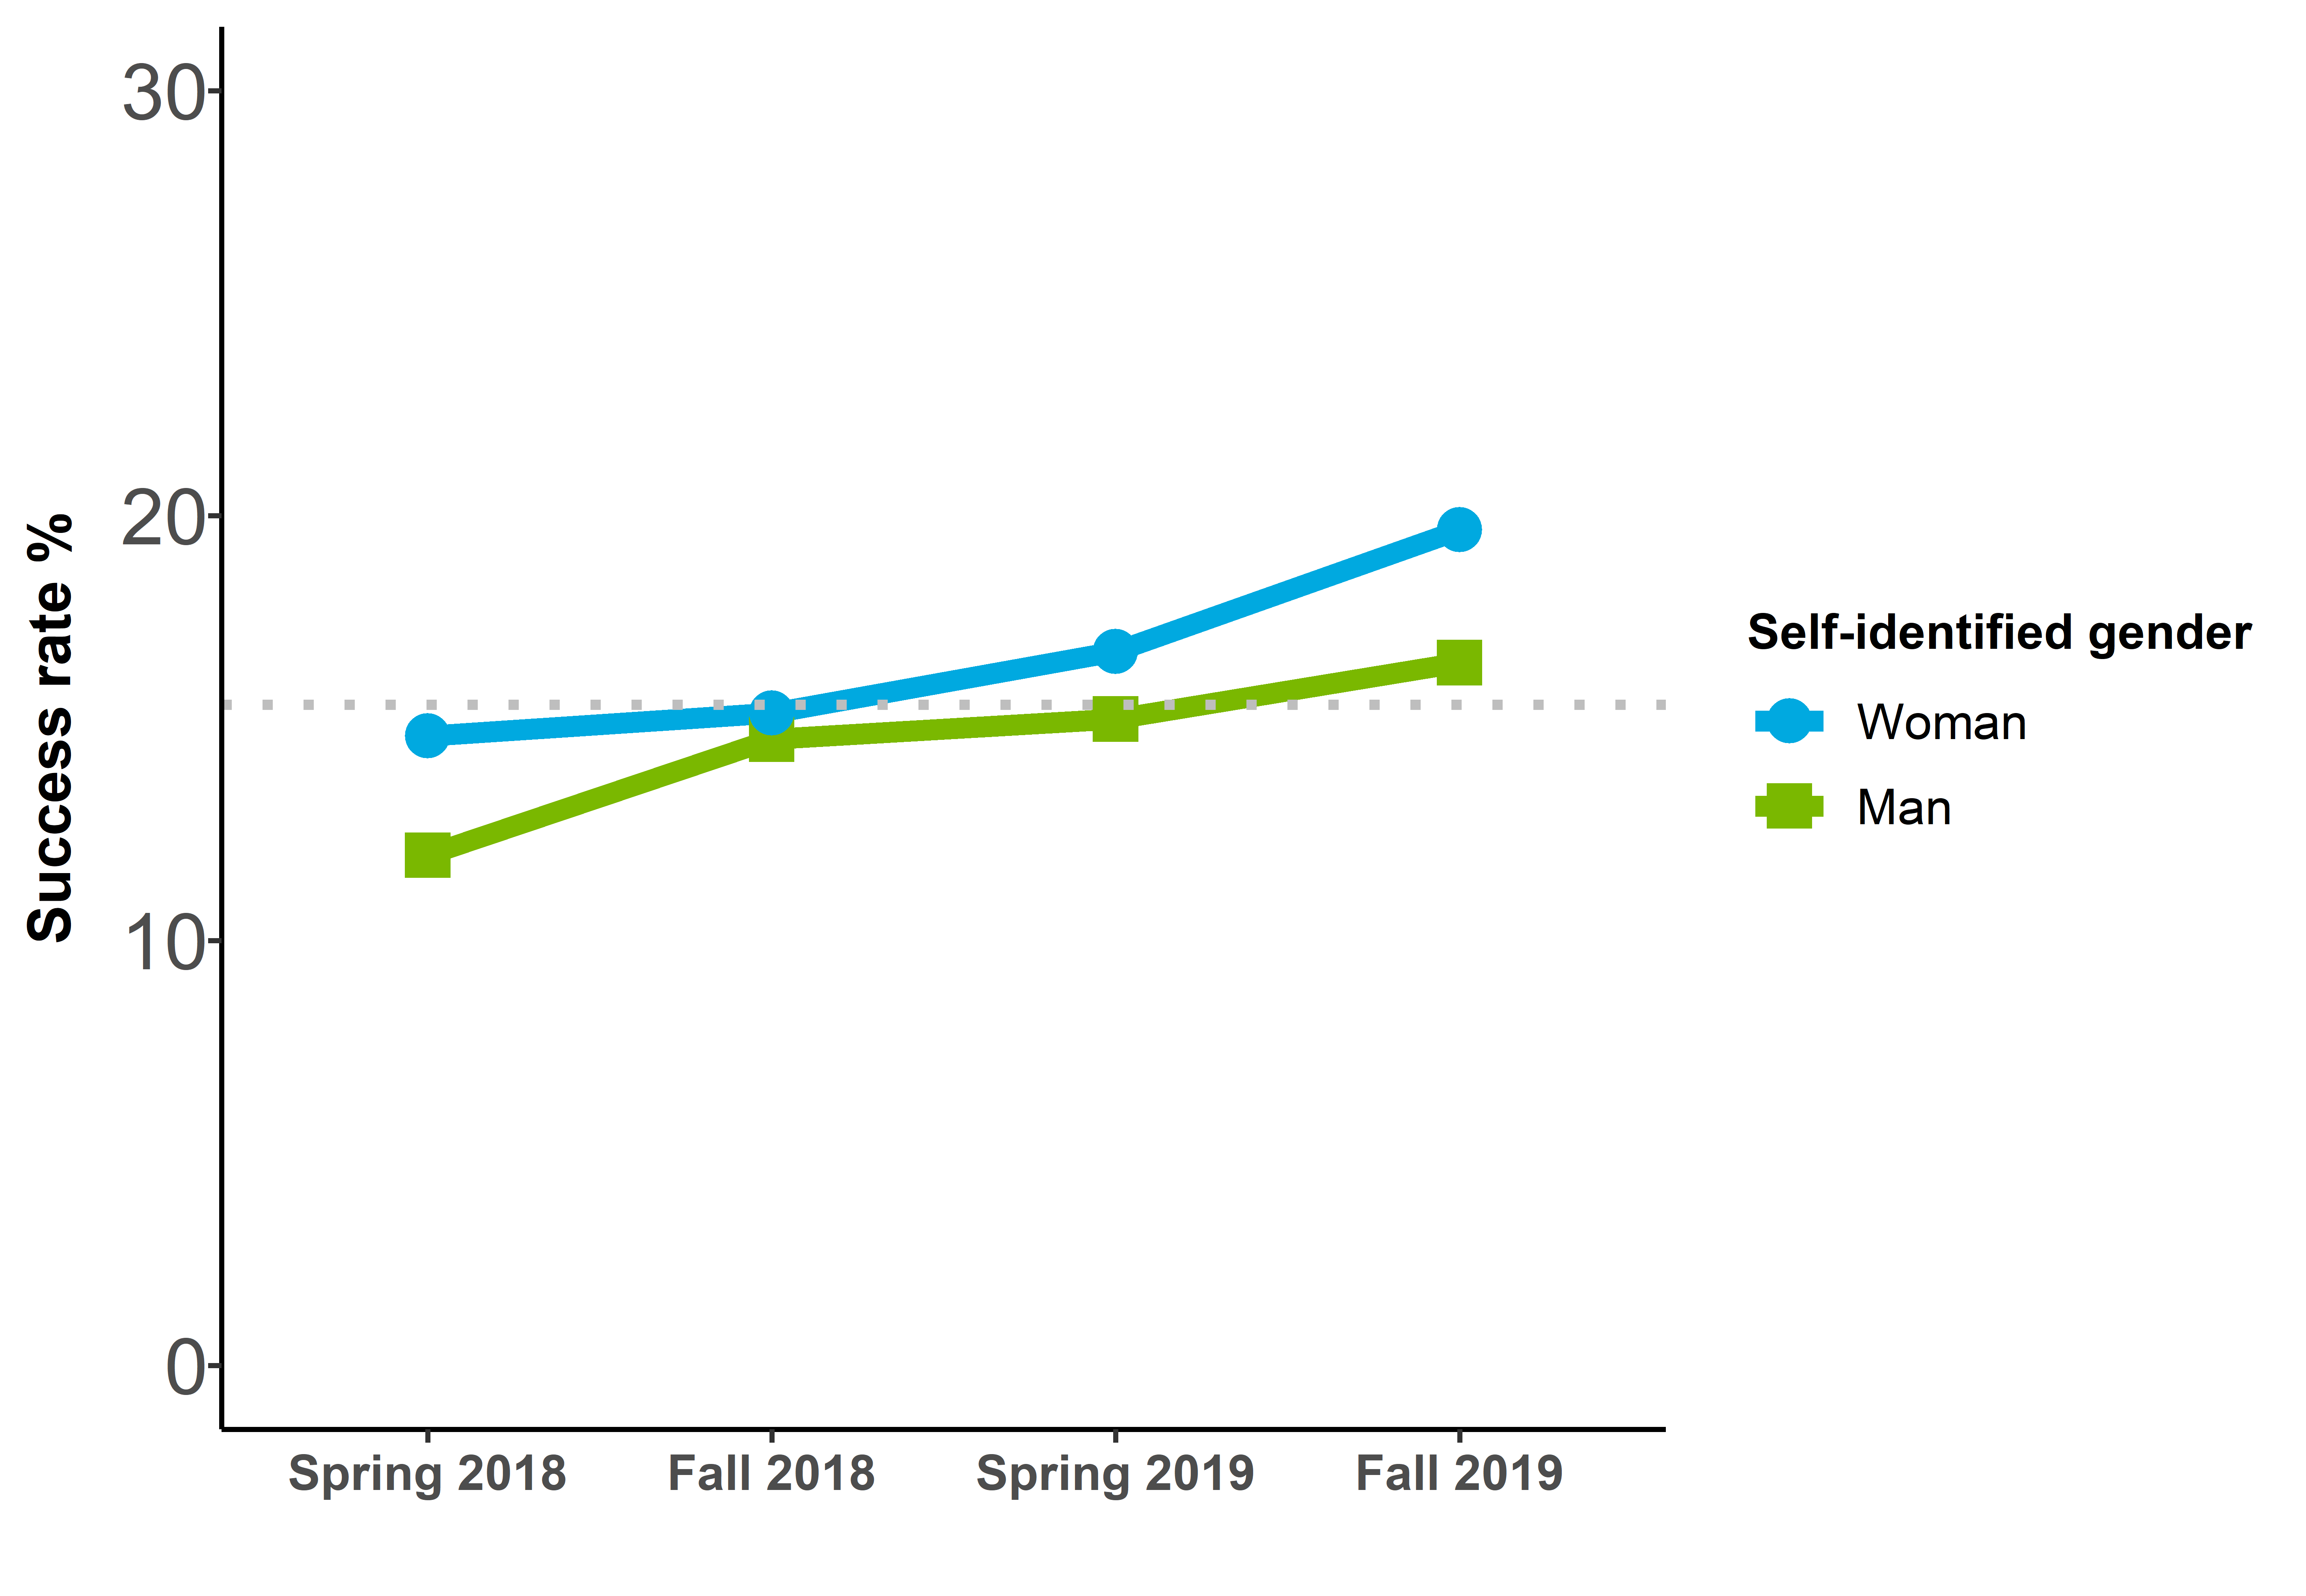
Grey dotted line represents the average success rates across these 4 competitions.
Figure 6 long description
| Response | Spring 2018 | Fall 2018 | Spring 2019 | Fall 2019 |
|---|---|---|---|---|
| Woman | 14.8% | 15.4% | 16.8% | 19.7% |
| Man | 12% | 14.7% | 15.2% | 16.5% |
| I prefer not to answer | 13.1% | 14.5% | 11.9% | 17.6% |
Self-identified person with a disability
Figure 7: Application rates by self-identified person with a disability
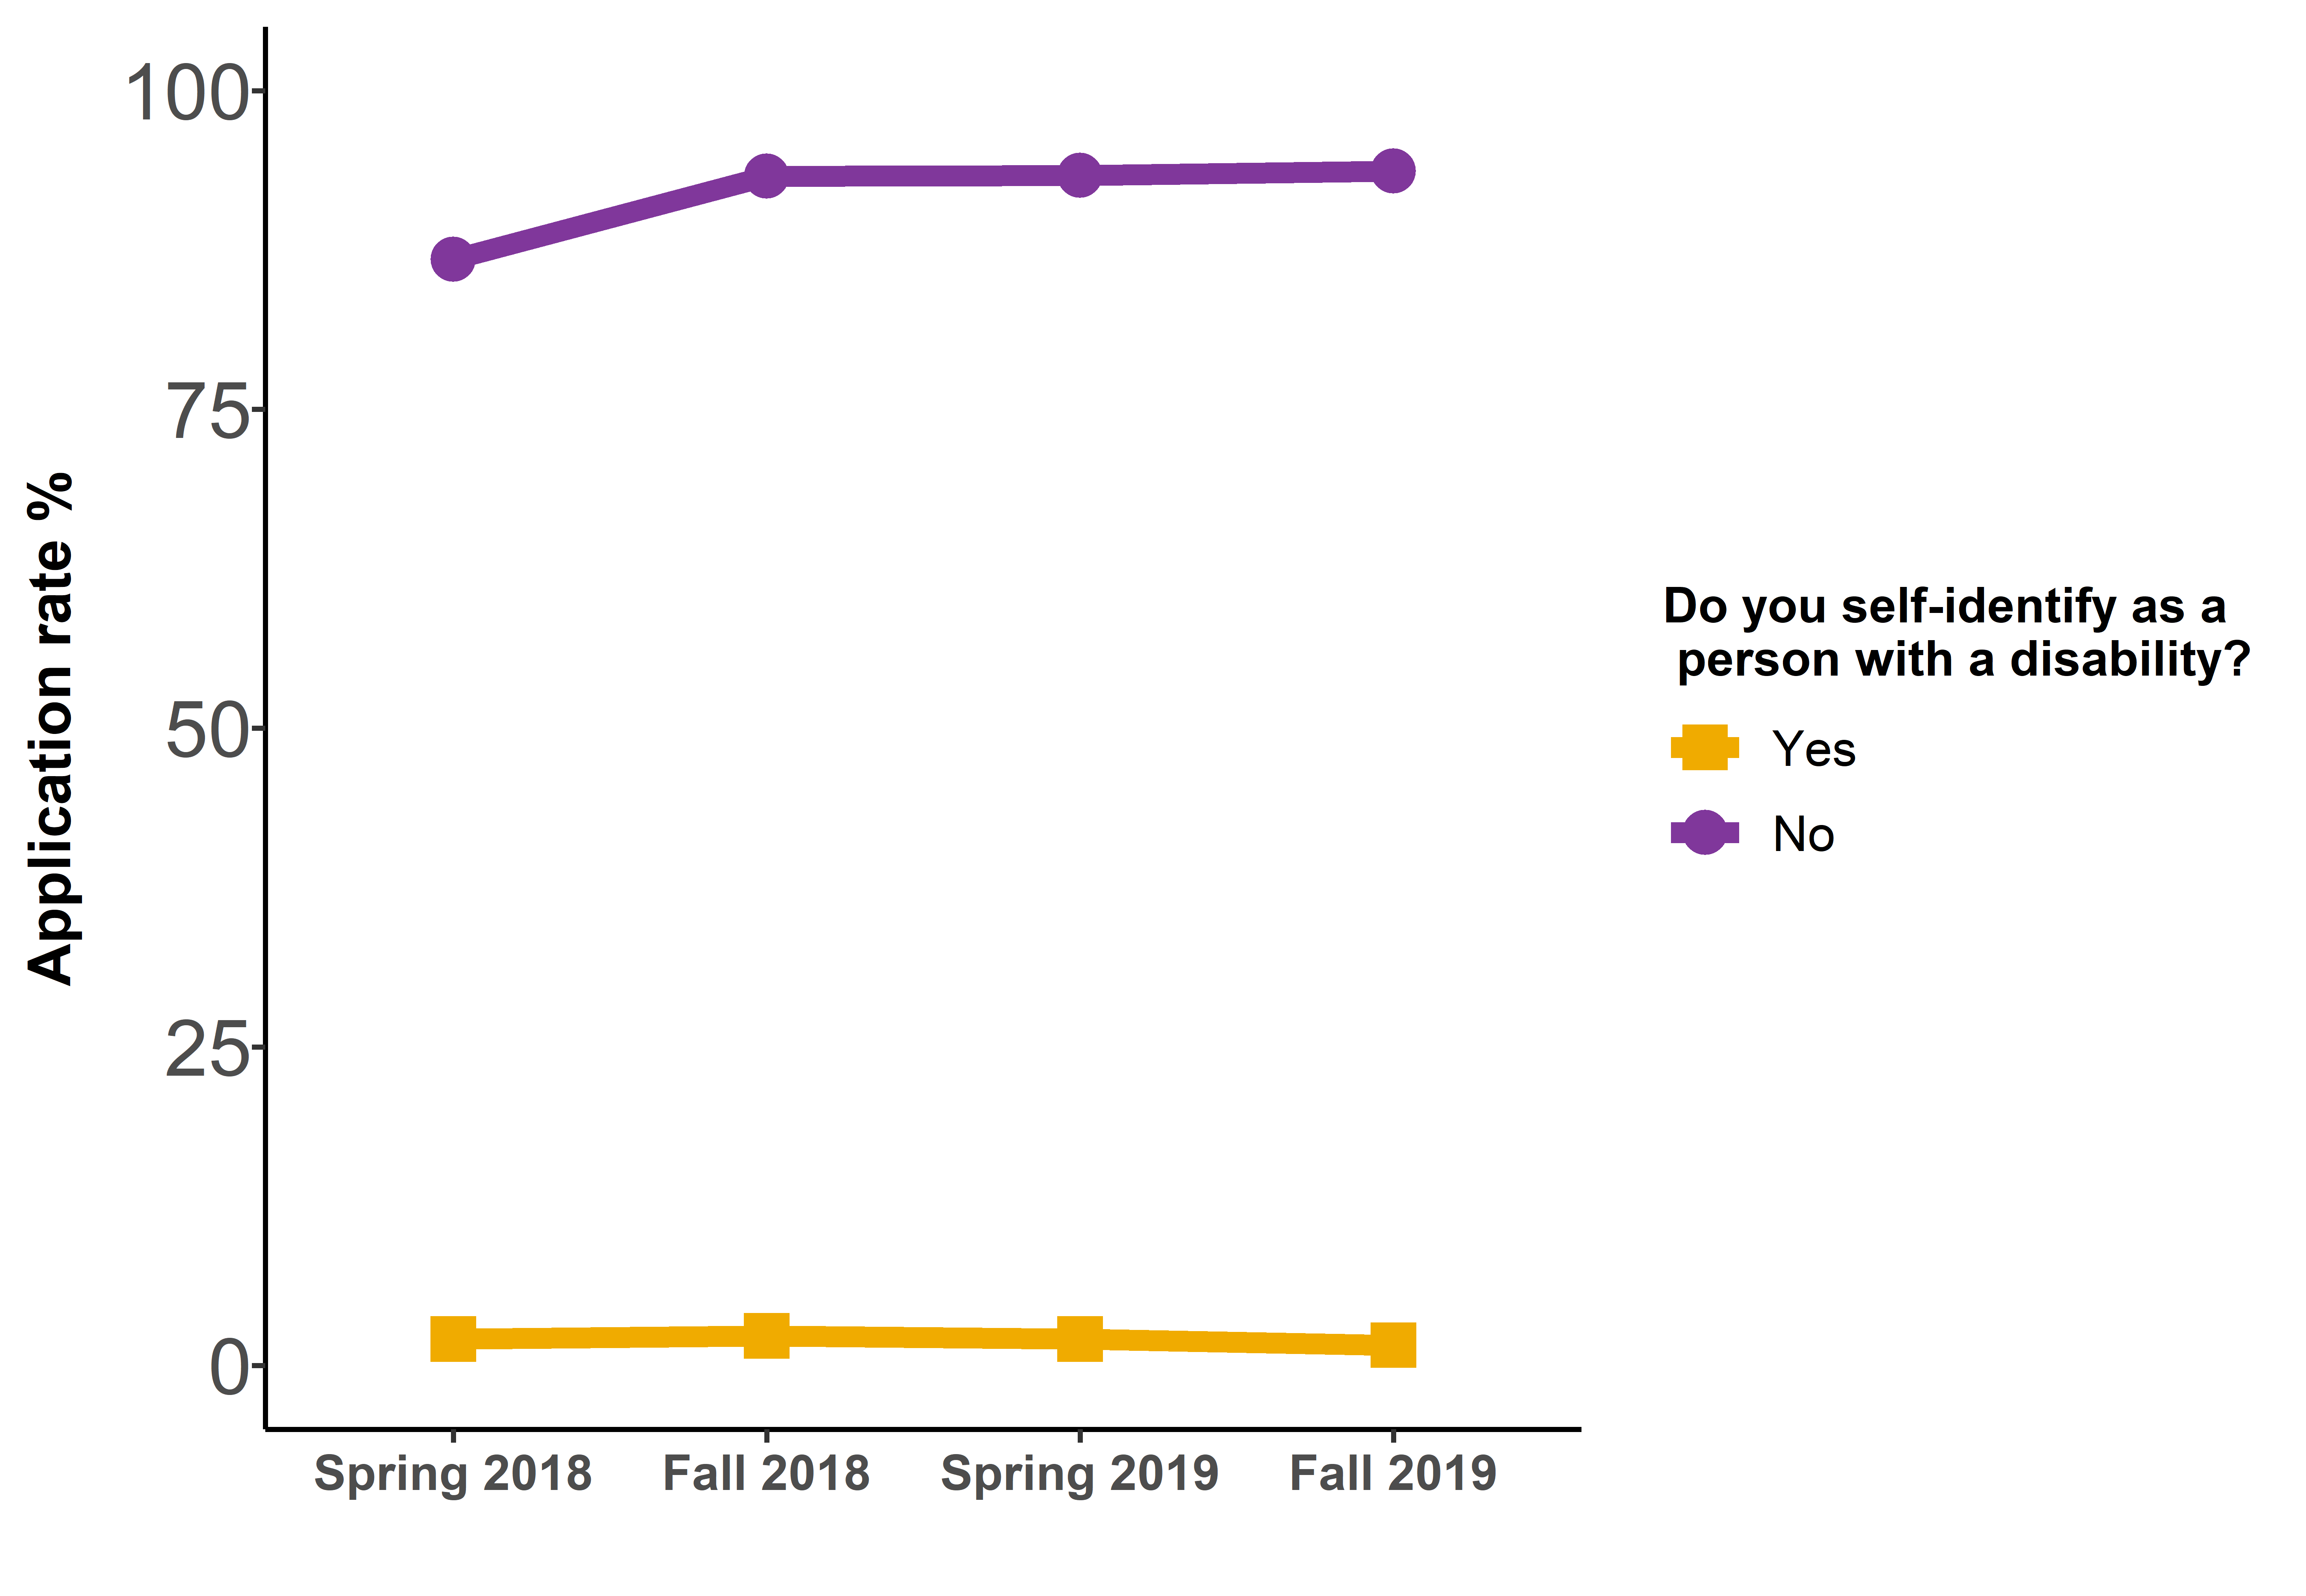
Figure 7 long description
| Response | Spring 2018 | Fall 2018 | Spring 2019 | Fall 2019 |
|---|---|---|---|---|
| Yes | 2.1% | 2.3% | 2.1% | 1.6% |
| No | 86.8% | 93.3% | 93.3% | 93.7% |
| I prefer not to answer | 4.5% | 4.4% | 4.6% | 4.7% |
Figure 8: Proportion of successful applicants by self-identified person with a disability
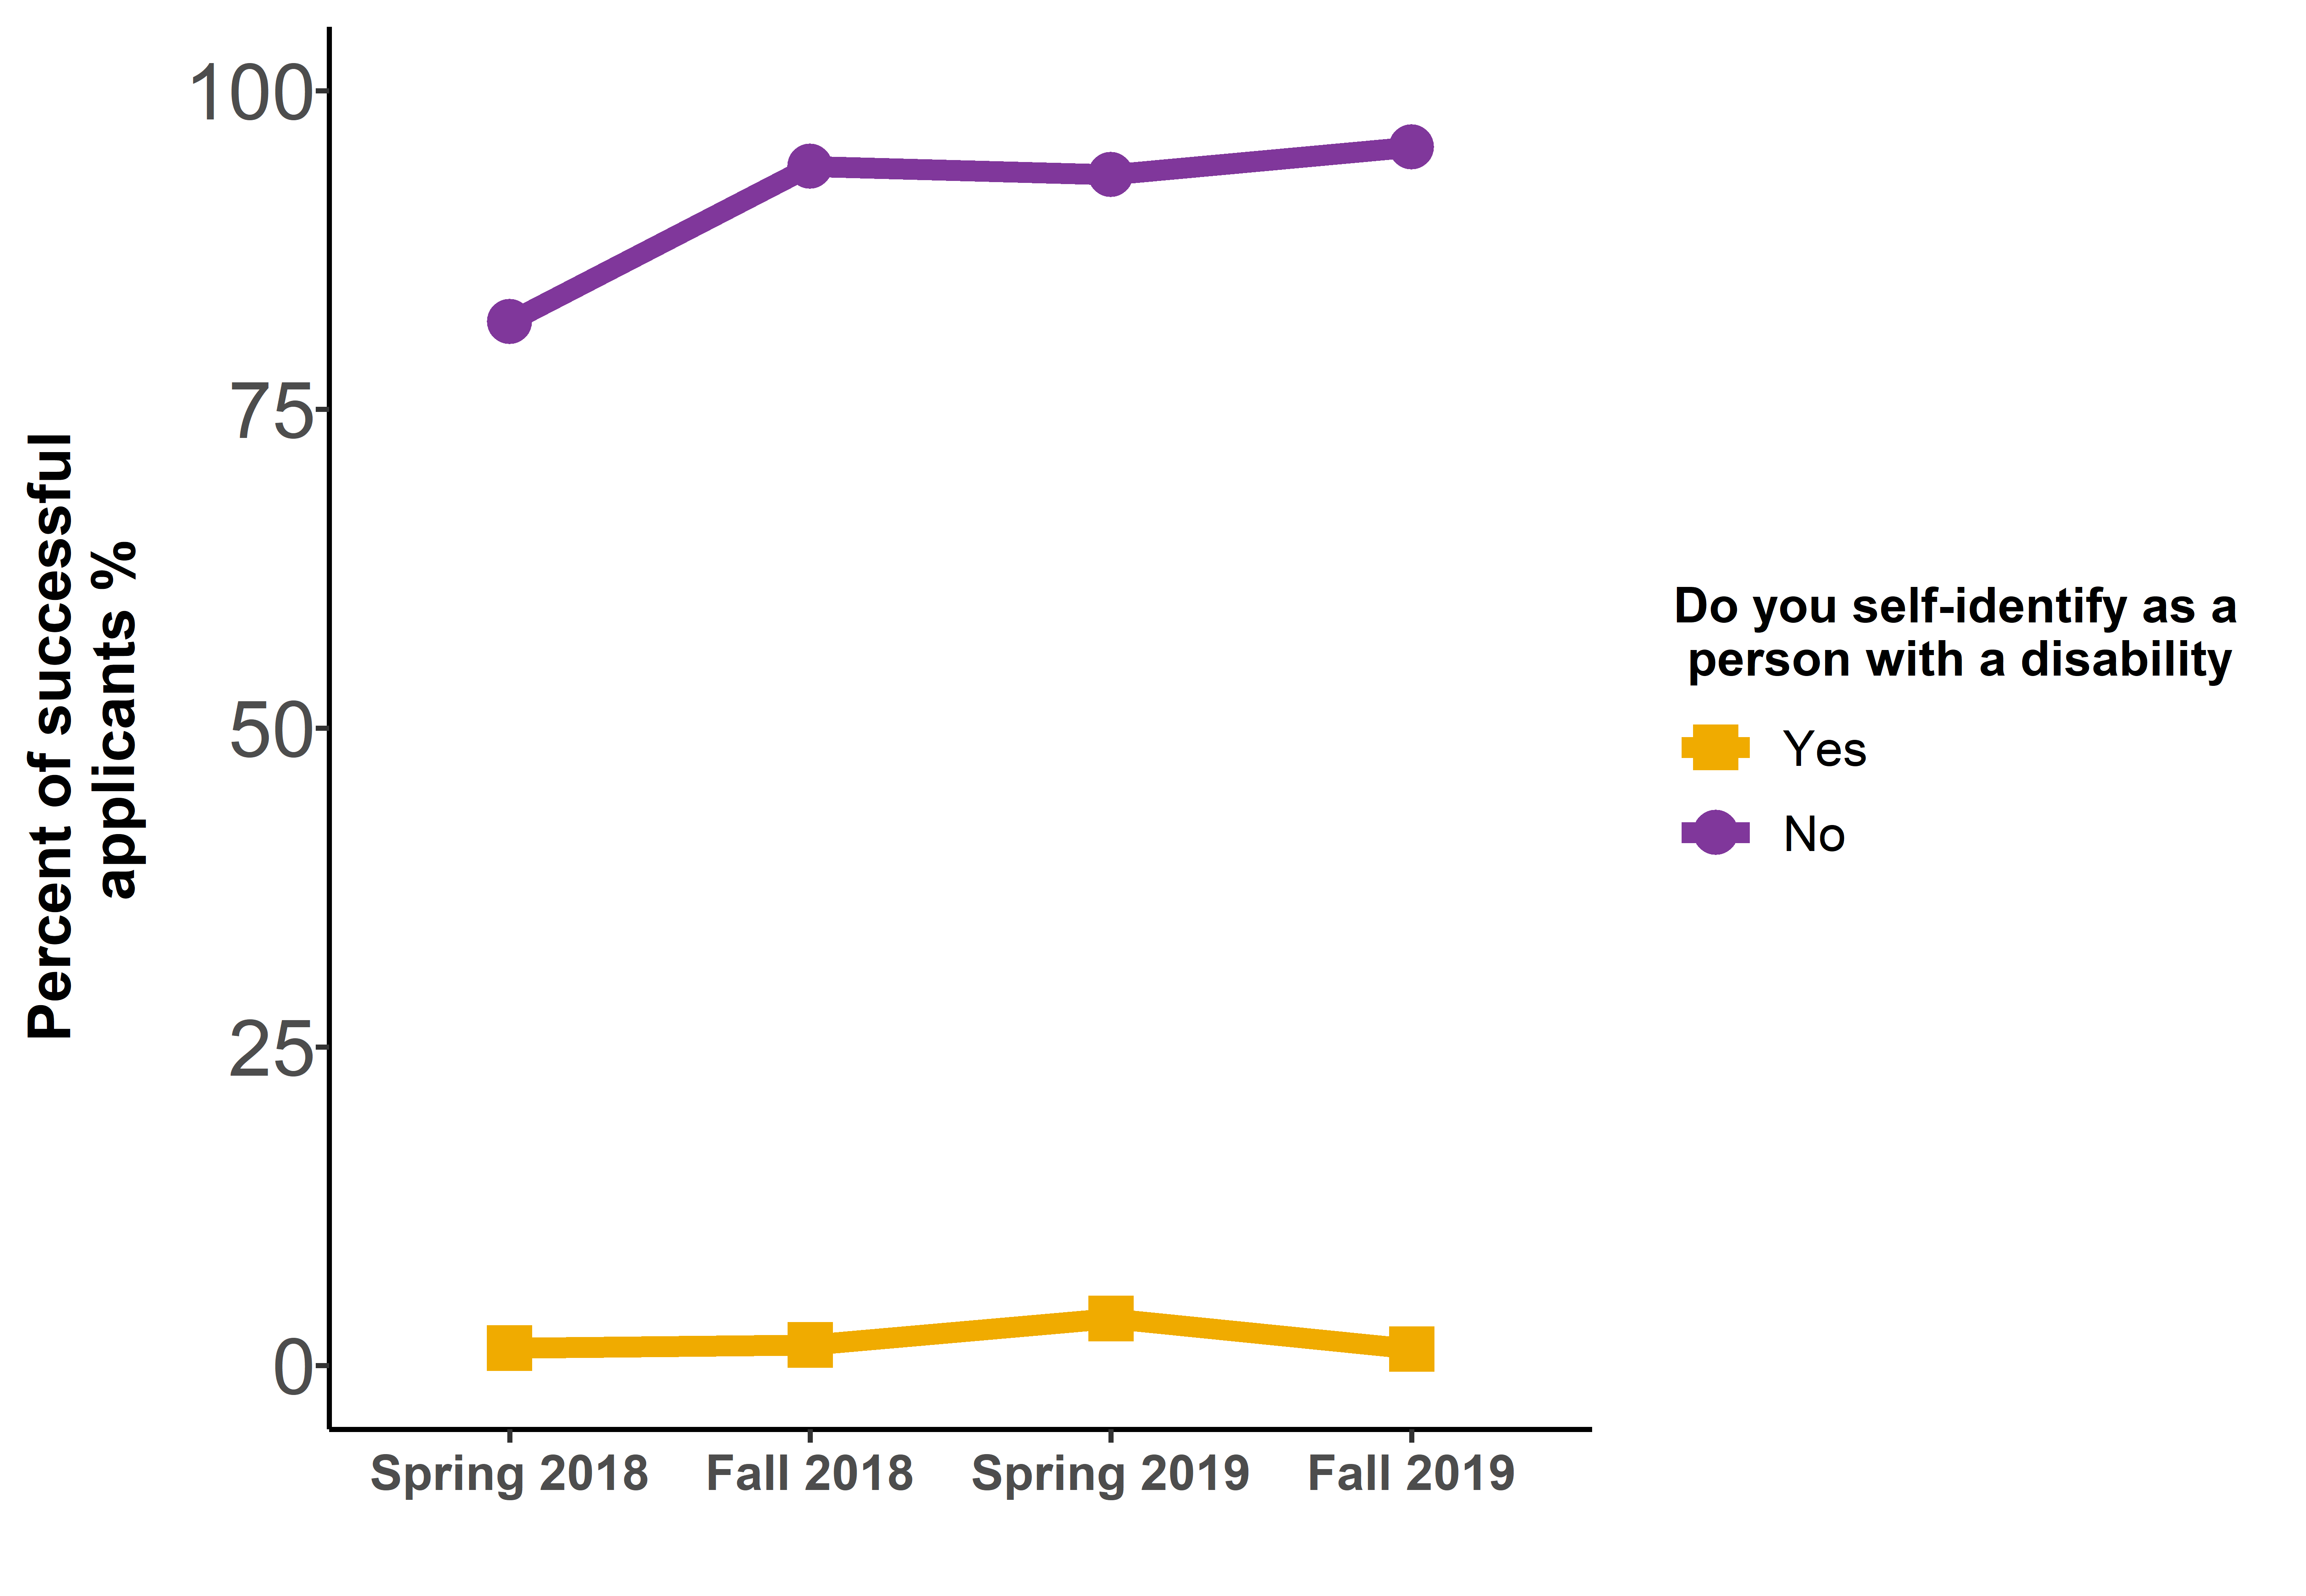
Figure 8 long description
| Response | Spring 2018 | Fall 2018 | Spring 2019 | Fall 2019 |
|---|---|---|---|---|
| Yes | 1.4% | 1.6% | 3.7% | 1.3% |
| No | 81.9% | 94.1% | 93.4% | 95.6% |
| I prefer not to answer | 3.6% | 4.3% | 2.9% | 3.1% |
Figure 9: Success rates by self‐identified person with a disability
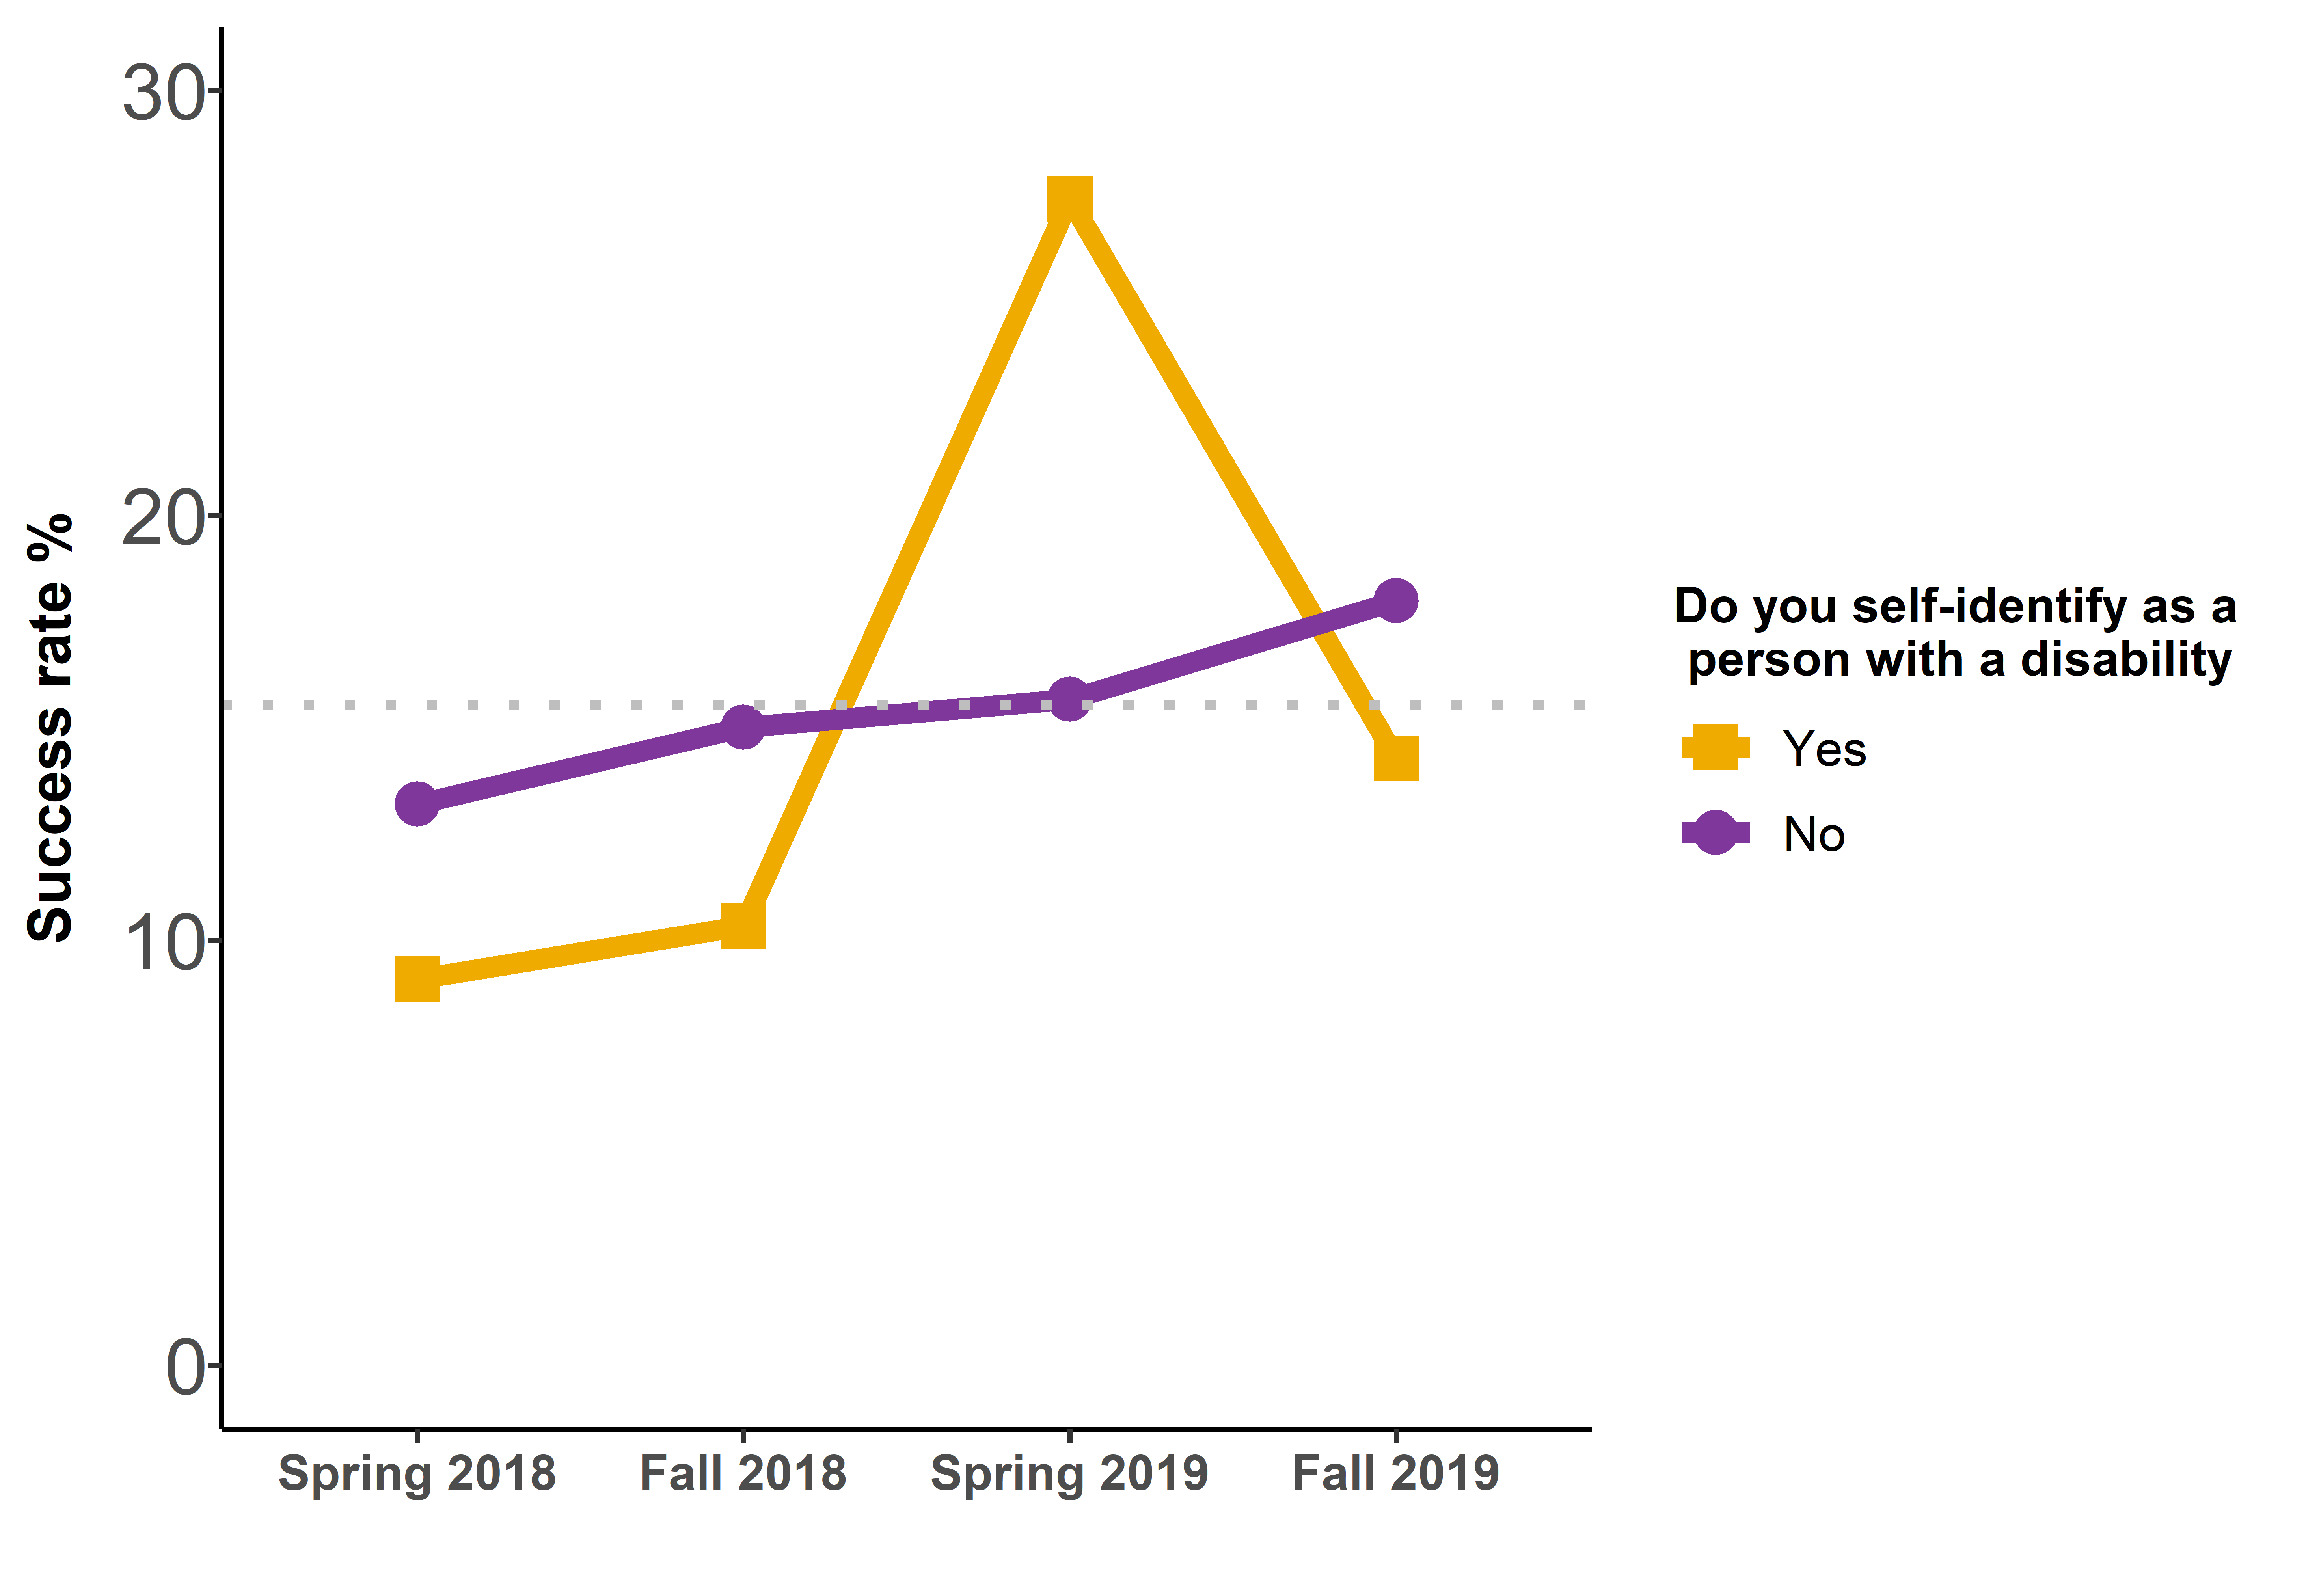
Grey dotted line represents the average success rates across these 4 competitions.
Figure 9 long description
| Response | Spring 2018 | Fall 2018 | Spring 2019 | Fall 2019 |
|---|---|---|---|---|
| Yes | 9.1% | 10.3% | 27.5% | 14.3% |
| No | 13.2% | 15% | 15.7% | 18% |
| I prefer not to answer | 10.9% | 15.6% | 9.8% | 11.7% |
Intersection between self‐identification data and career stage
Figure 10: Application rates by career stage
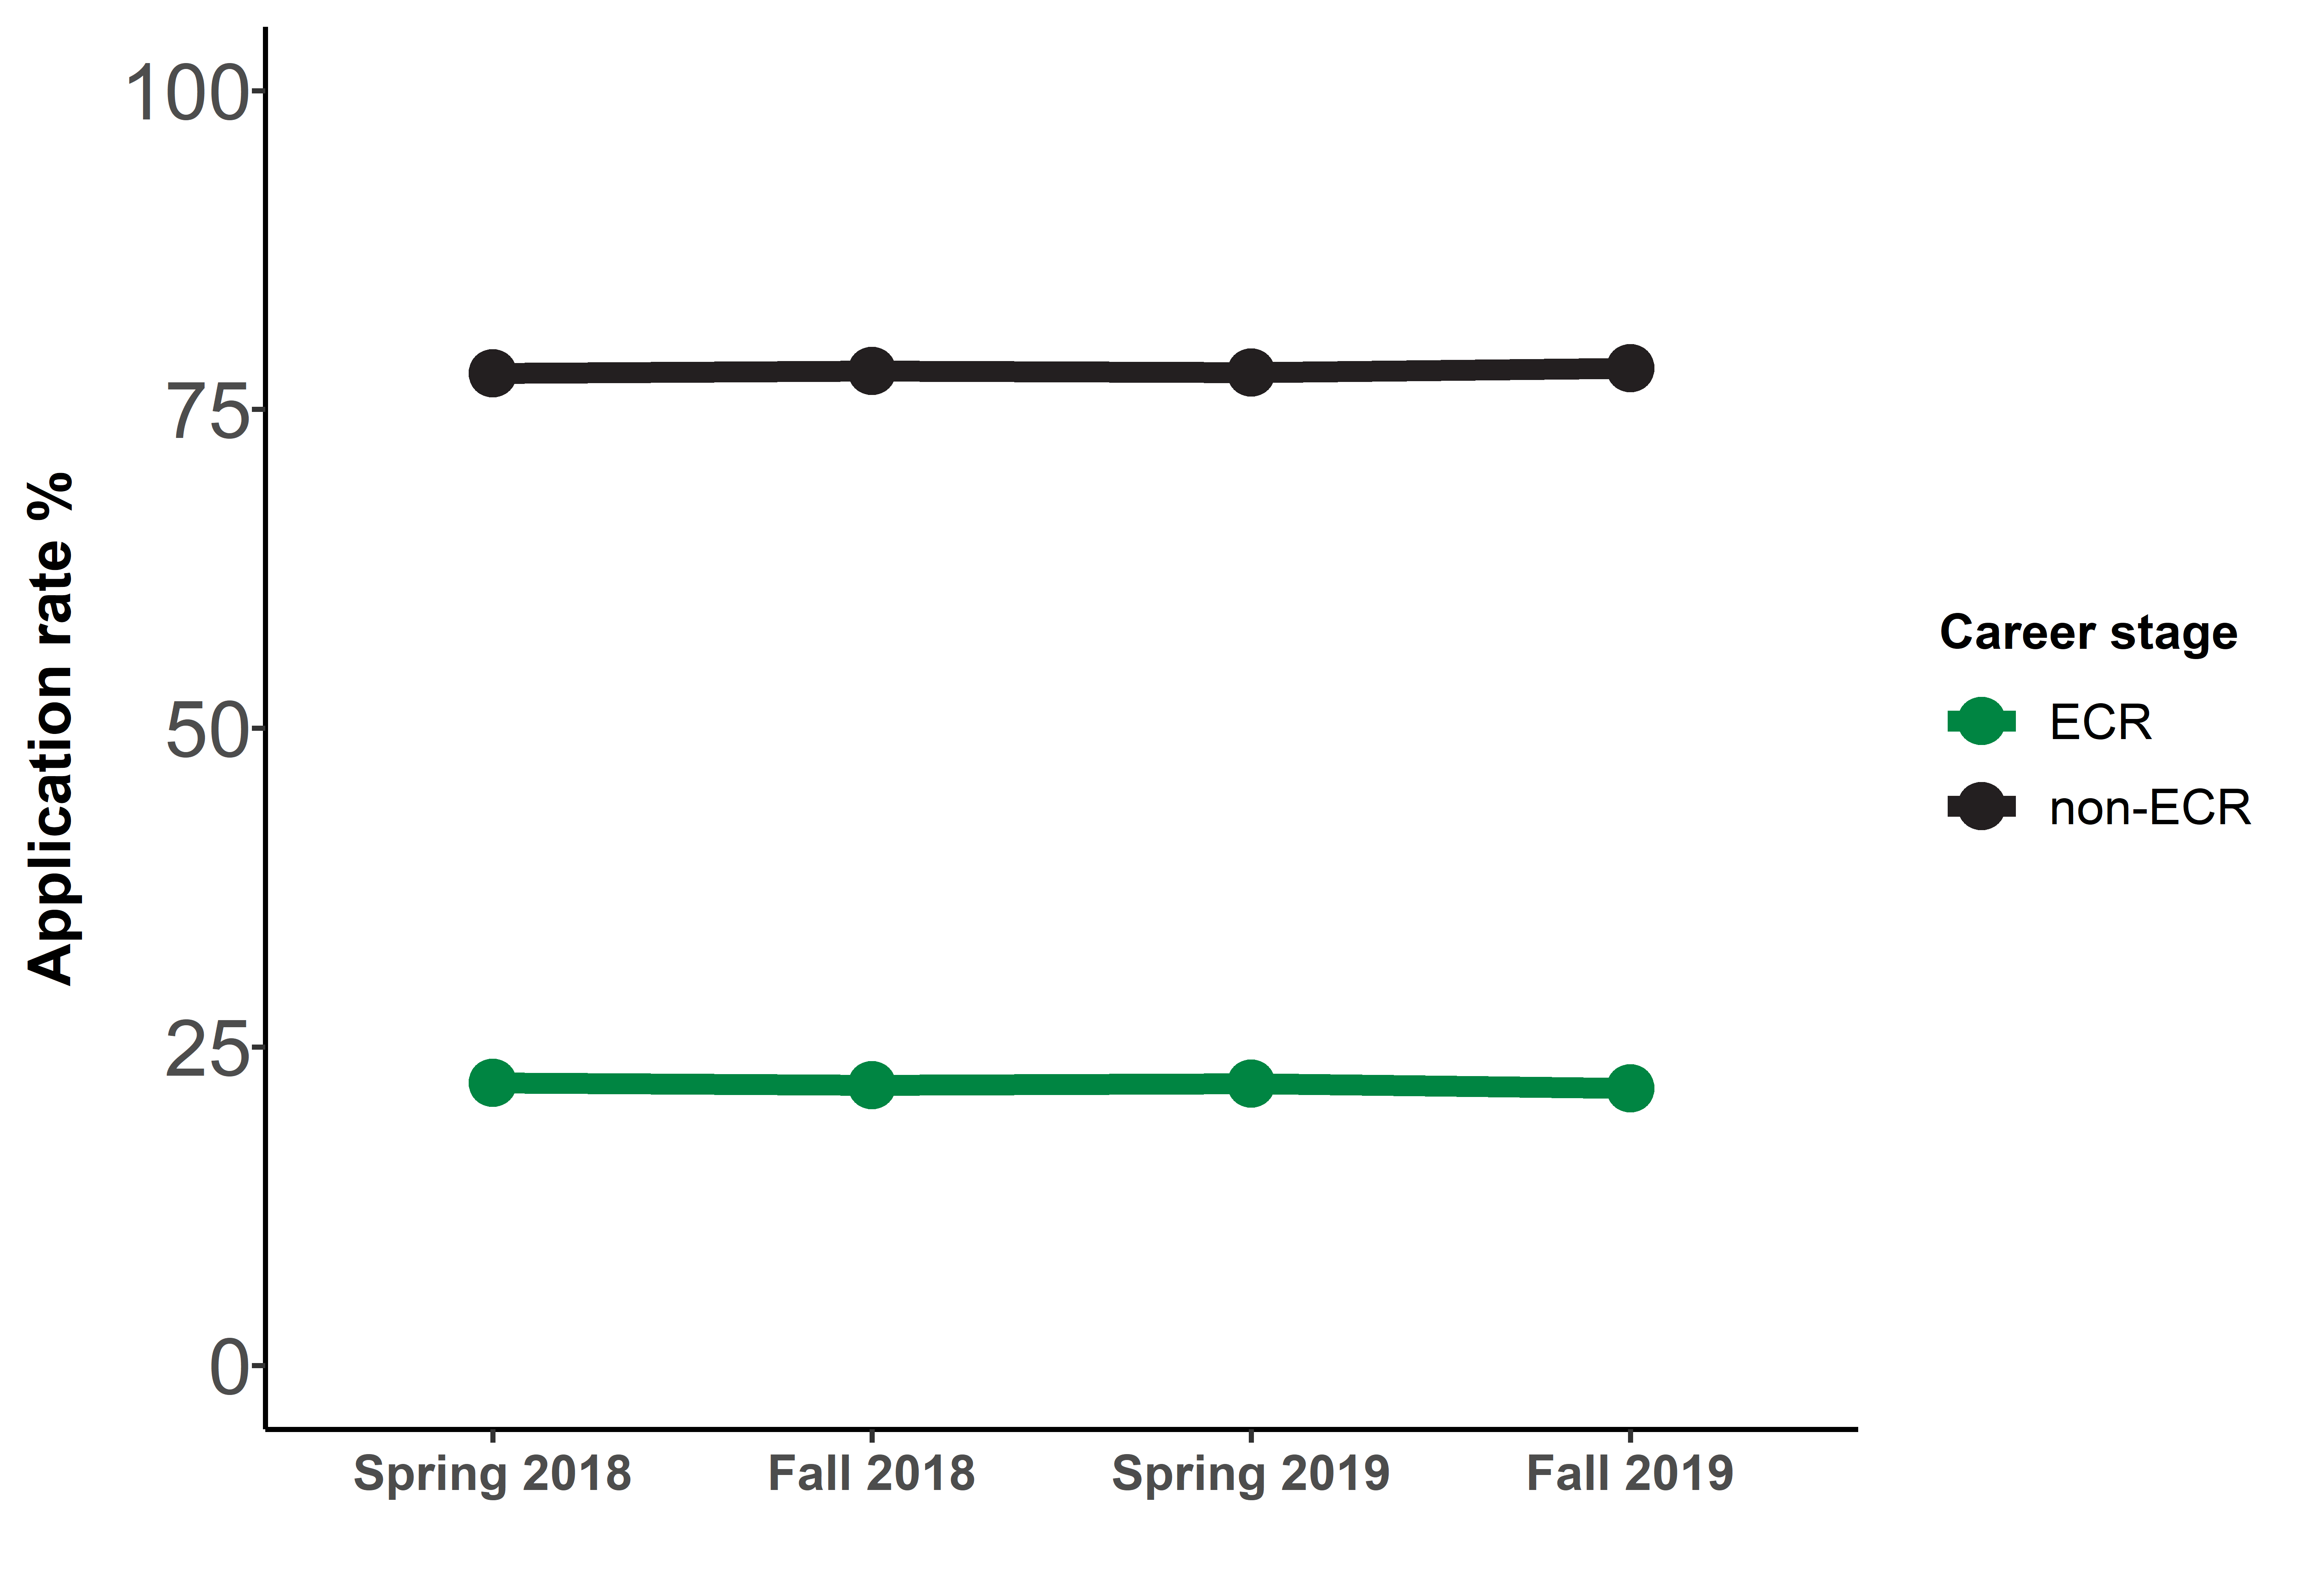
Figure 10 long description
| Career Stage | Spring 2018 | Fall 2018 | Spring 2019 | Fall 2019 |
|---|---|---|---|---|
| ECR | 22.2% | 22% | 22.1% | 21.8% |
| Non-ECR | 77.8% | 78% | 77.9% | 78.2% |
Figure 11: Proportion of successful applicants by career stage
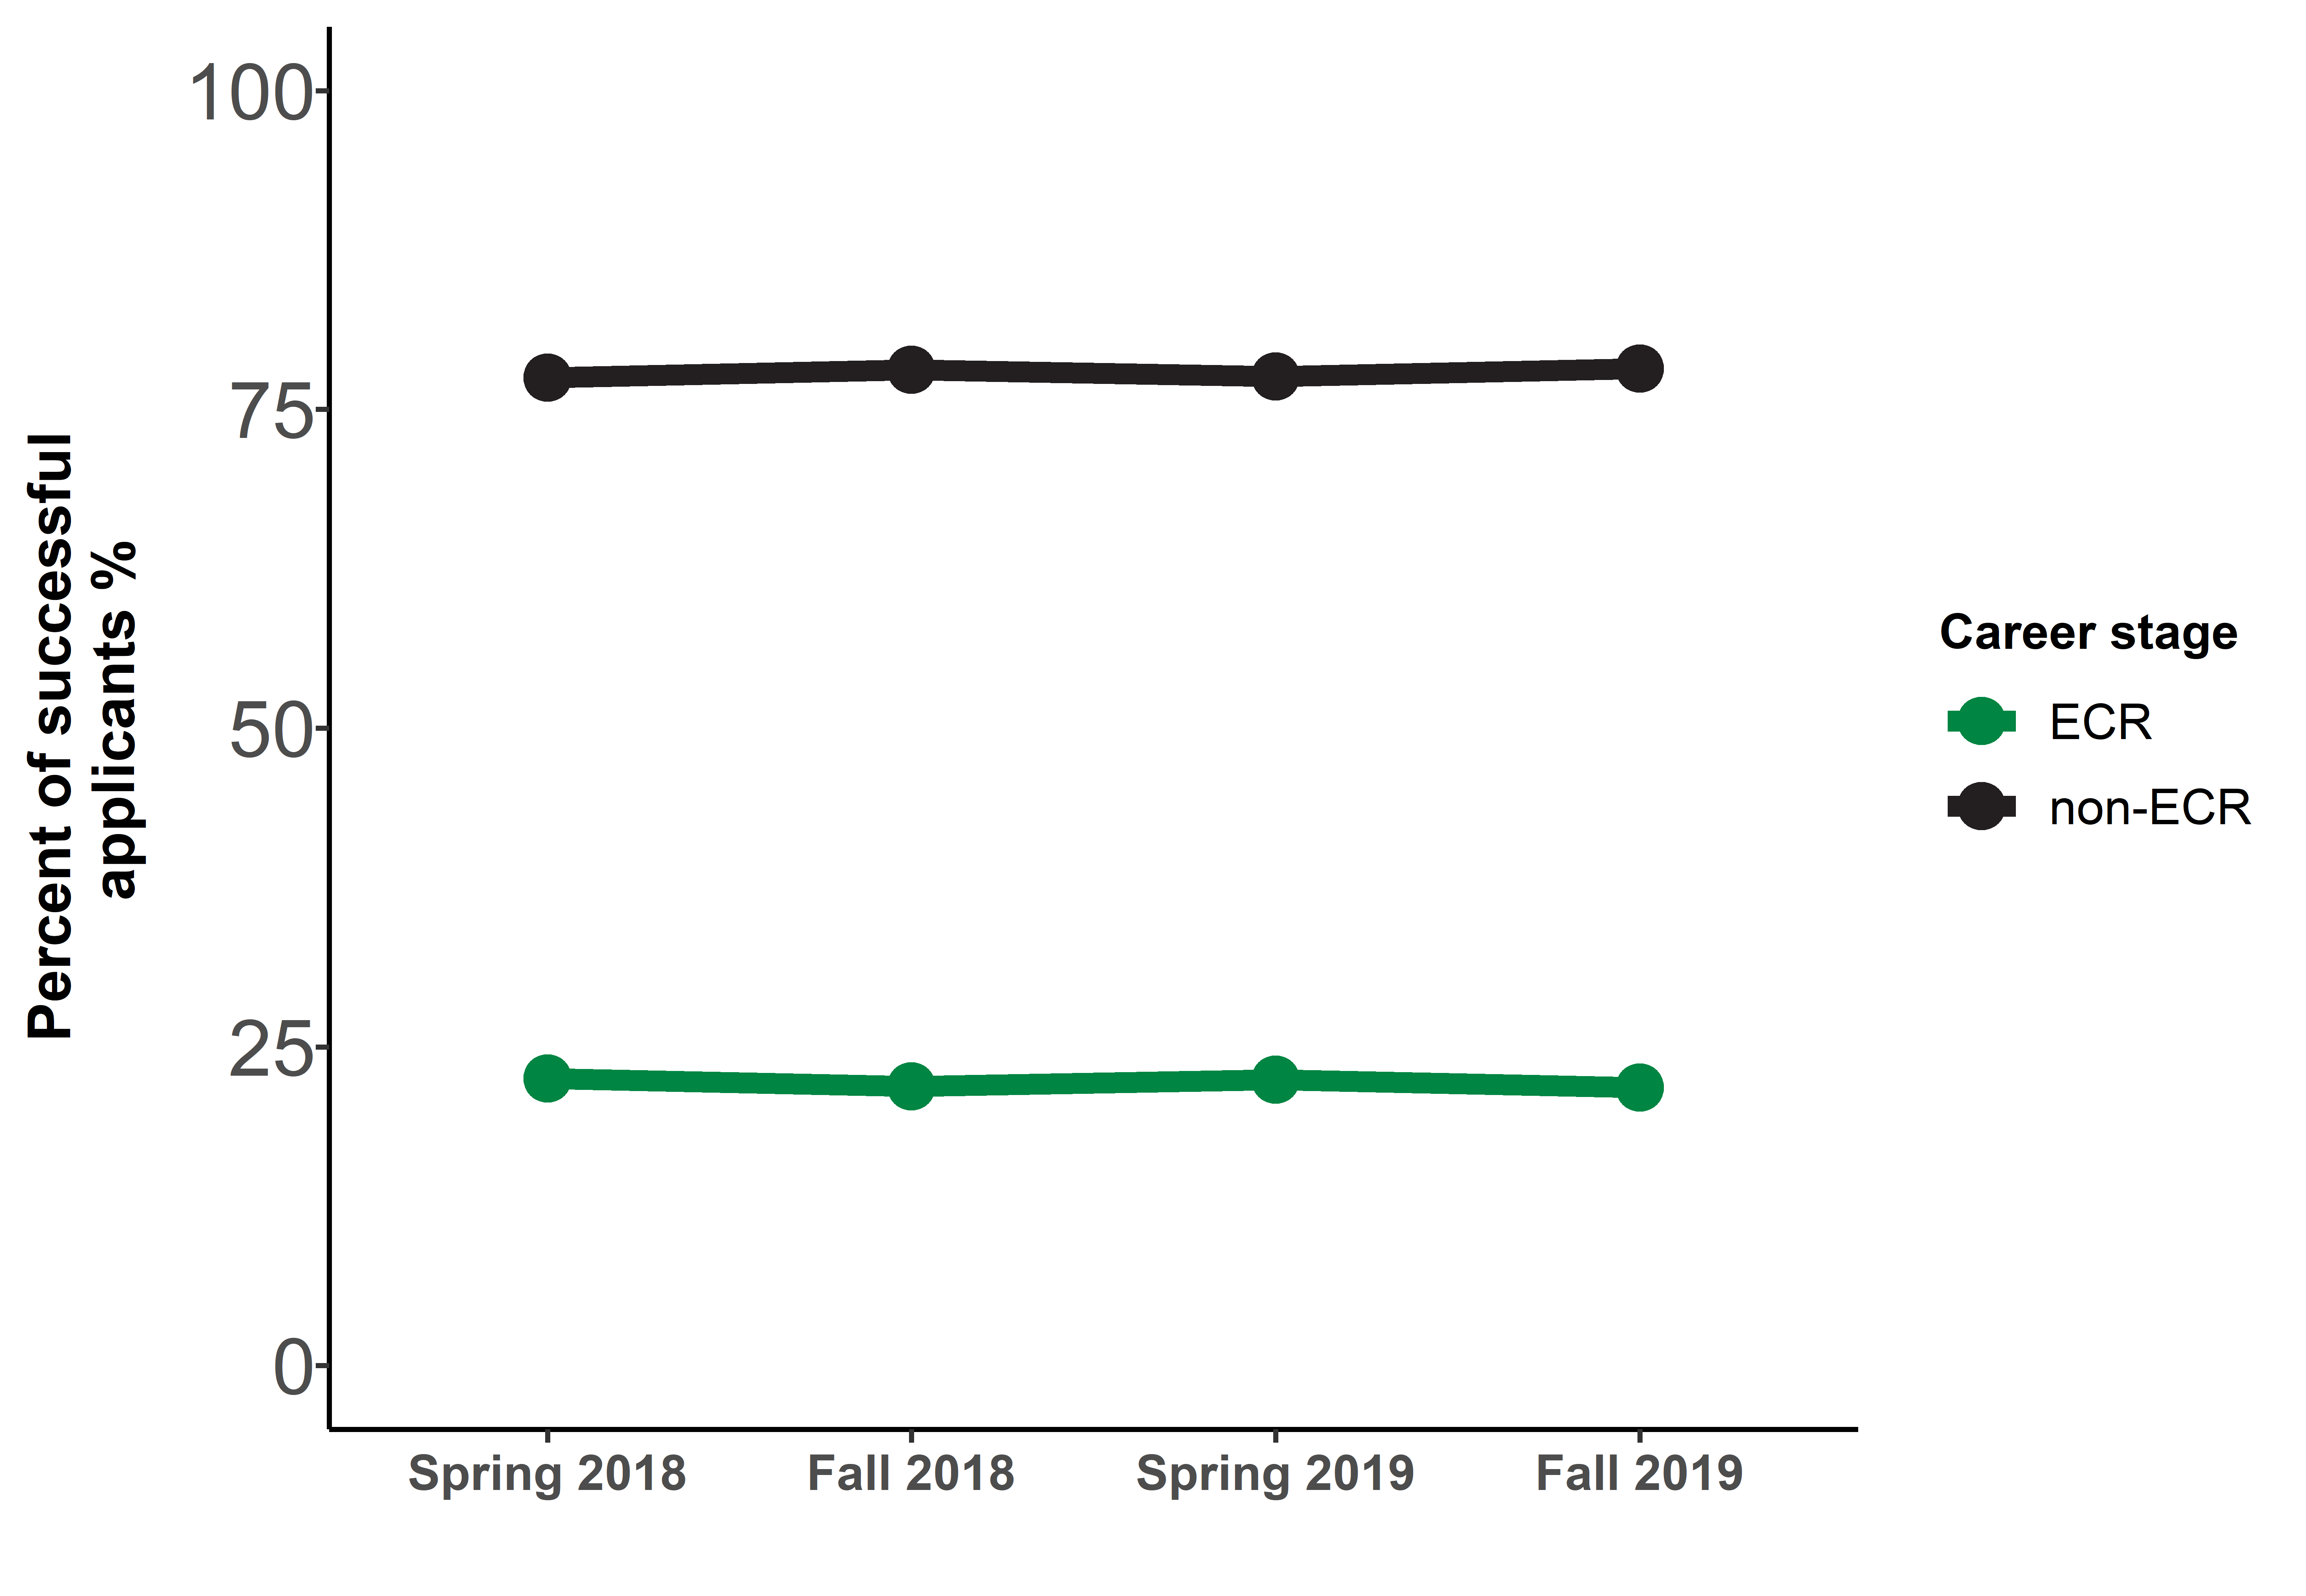
Figure 11 long description
| Career Stage | Spring 2018 | Fall 2018 | Spring 2019 | Fall 2019 |
|---|---|---|---|---|
| ECR | 22.5% | 21.9% | 22.4% | 21.8% |
| Non-ECR | 77.5% | 78.1% | 77.6% | 78.2% |
Figure 12: Success rates by career stage
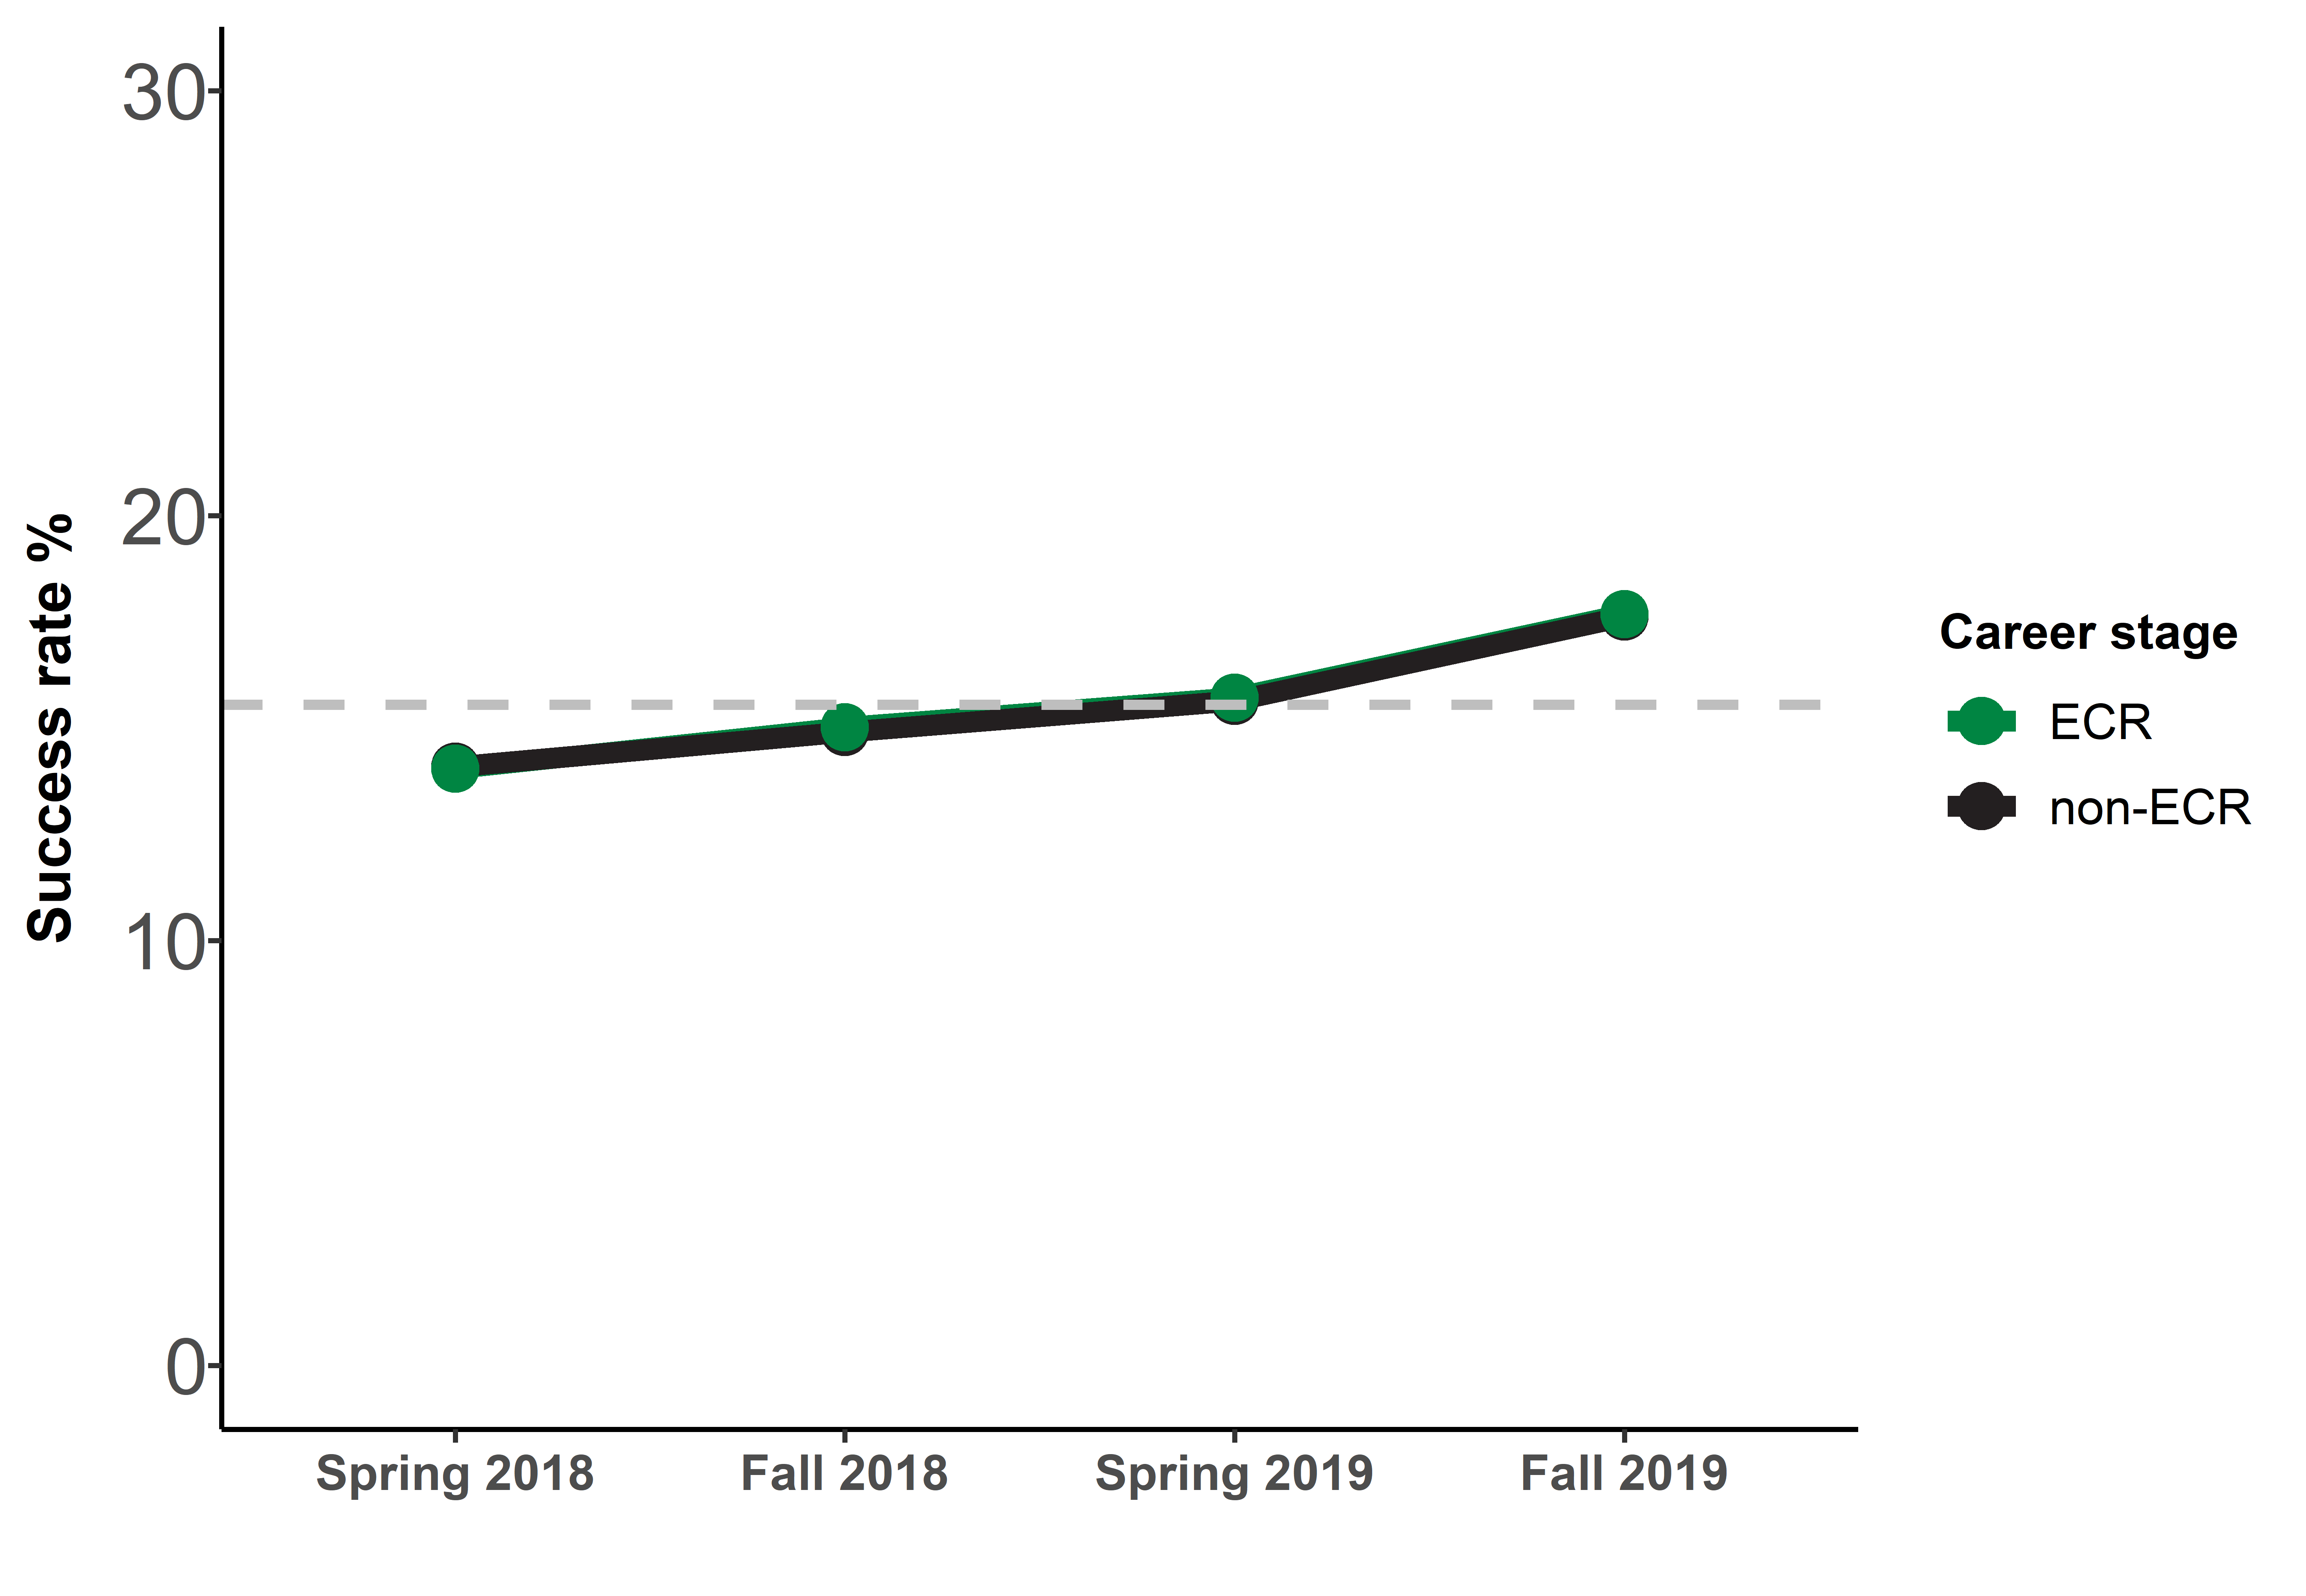
Grey dotted line represents the average success rates across these 4 competitions. Note that success rates for ECR and non-ECR were overlapping.
Figure 12 long description
| Career Stage | Spring 2018 | Fall 2018 | Spring 2019 | Fall 2019 |
|---|---|---|---|---|
| ECR | 14% | 15% | 15.7% | 17.7% |
| Non-ECR | 14.1% | 14.9% | 15.6% | 17.6% |
Figure 13: Proportion of successful applicants by self‐identified visible minority and career stage
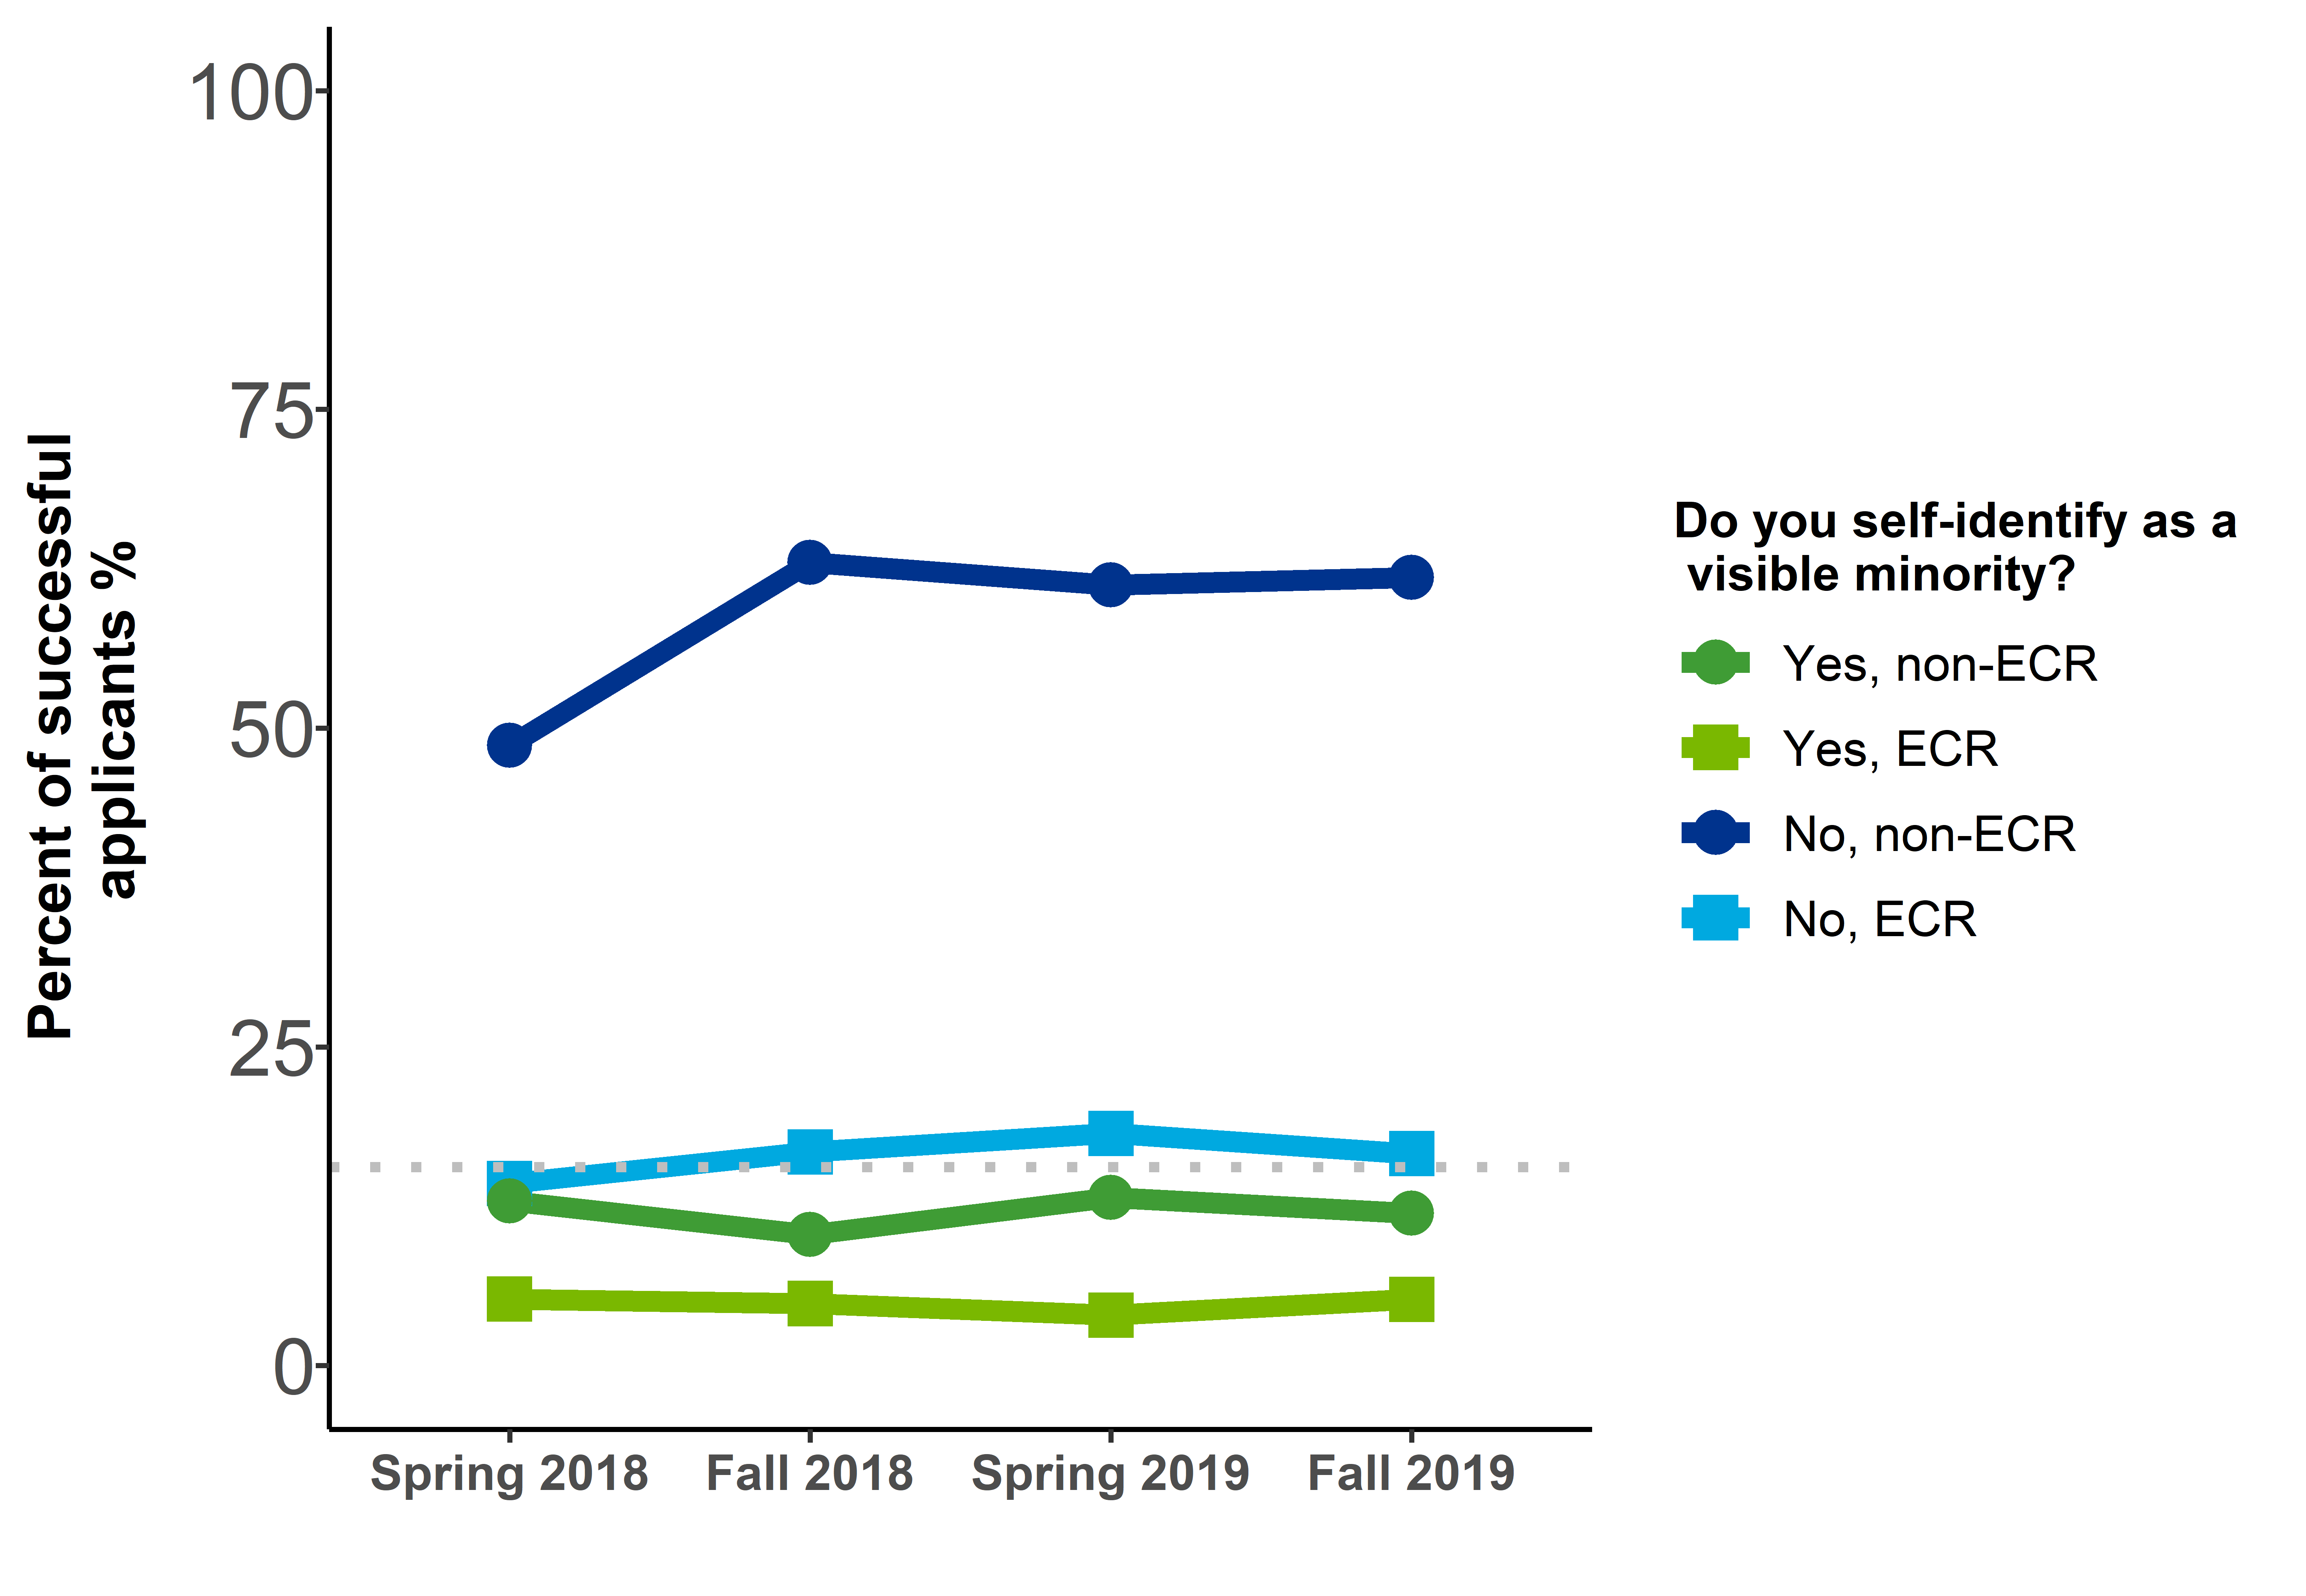
Figure 13 long description
| Response | Career stage | Spring 2018 | Fall 2018 | Spring 2019 | Fall 2019 |
|---|---|---|---|---|---|
| Yes | ECR | 5.2% | 4.9% | 4% | 5.2% |
| Yes | non-ECR | 12.9% | 10.3% | 13.2% | 11.9% |
| No | ECR | 14.3% | 16.8% | 18.2% | 16.6% |
| No | non-ECR | 48.6% | 63% | 61.2% | 61.8% |
| I prefer not to answer | ECR | 1.1% | <1% | <1% | <1% |
| I prefer not to answer | non-ECR | 4.7% | 4.9% | 3.2% | 4.4% |
Figure 14: Success rates by self‐identified visible minority and career stage
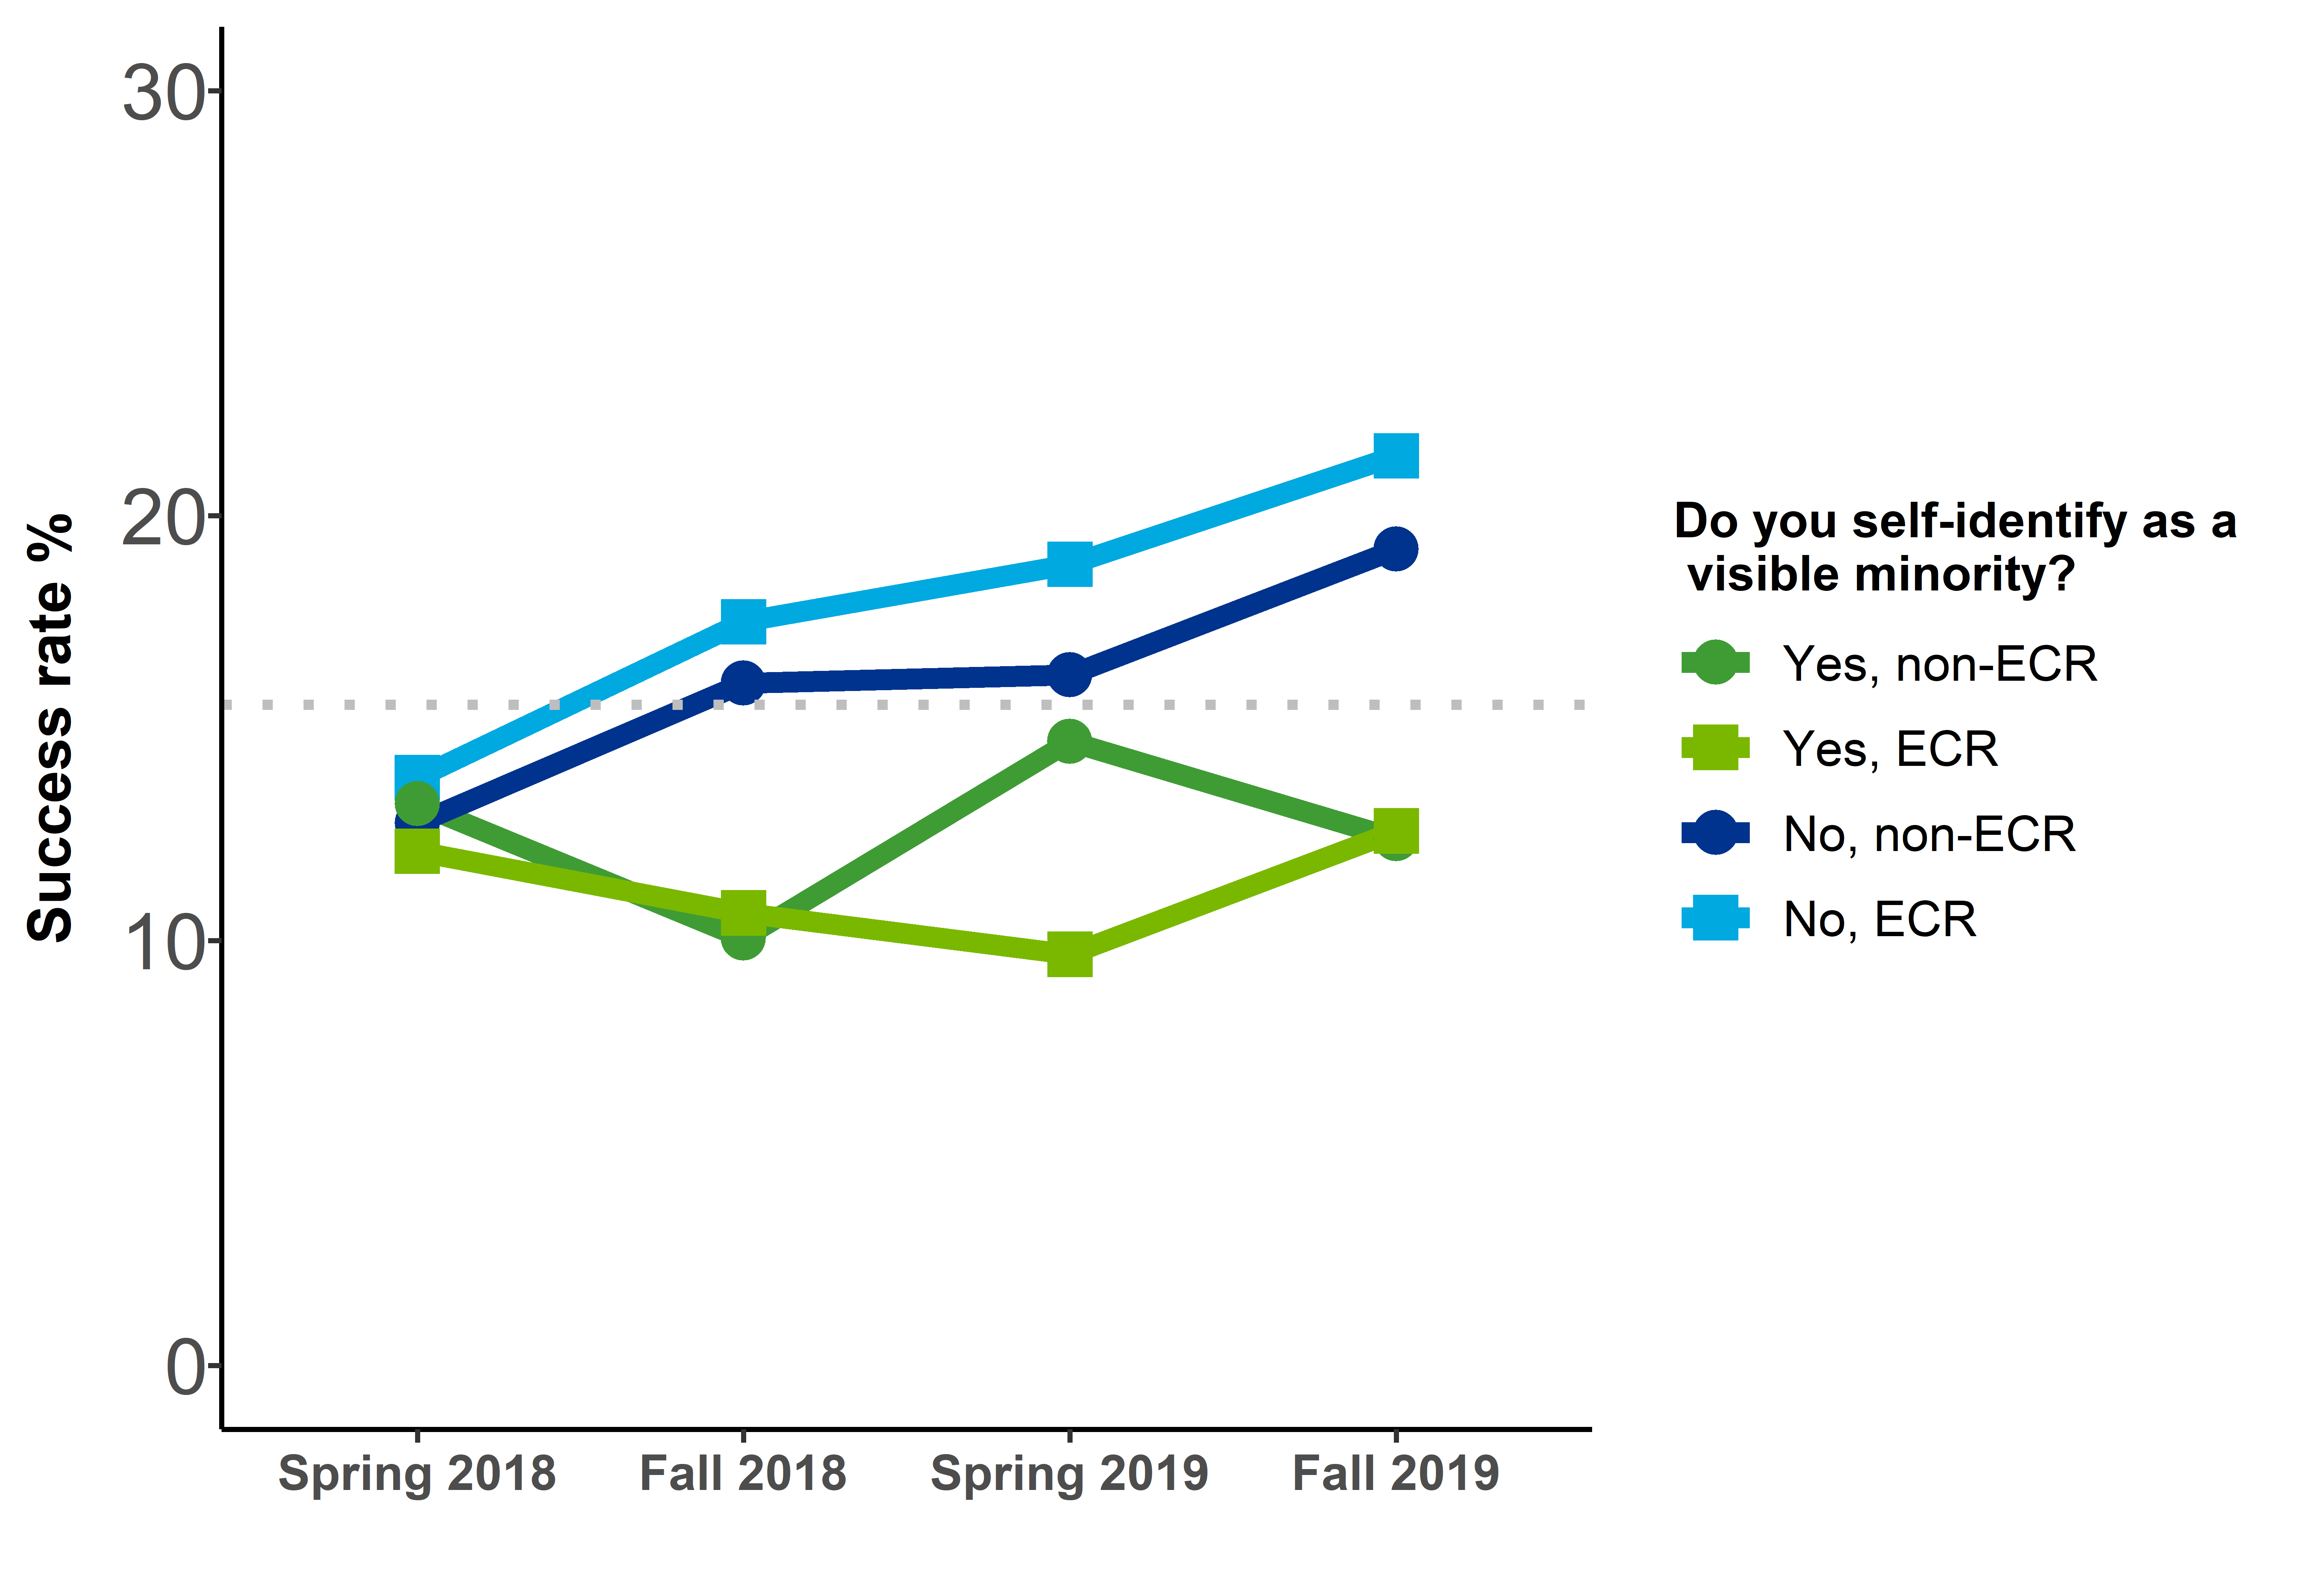
Grey dotted line represents the average success rates across these 4 competitions.
Figure 14 long description
| Response | Career stage | Spring 2018 | Fall 2018 | Spring 2019 | Fall 2019 |
|---|---|---|---|---|---|
| Yes | ECR | 12.1% | 10.7% | 9.7% | 12.6% |
| Yes | non-ECR | 13.2% | 10.1% | 14.7% | 12.4% |
| No | ECR | 13.8% | 17.5% | 18.9% | 21.4% |
| No | non-ECR | 12.8% | 16.1% | 16.2% | 19.2% |
| I prefer not to answer | ECR | 21.1% | low N | low N | low N |
| I prefer not to answer | non-ECR | 12.6% | 16.5% | 10.8% | 17.3% |
Figure 15: Proportion of successful applicants by self-identified gender and career stage
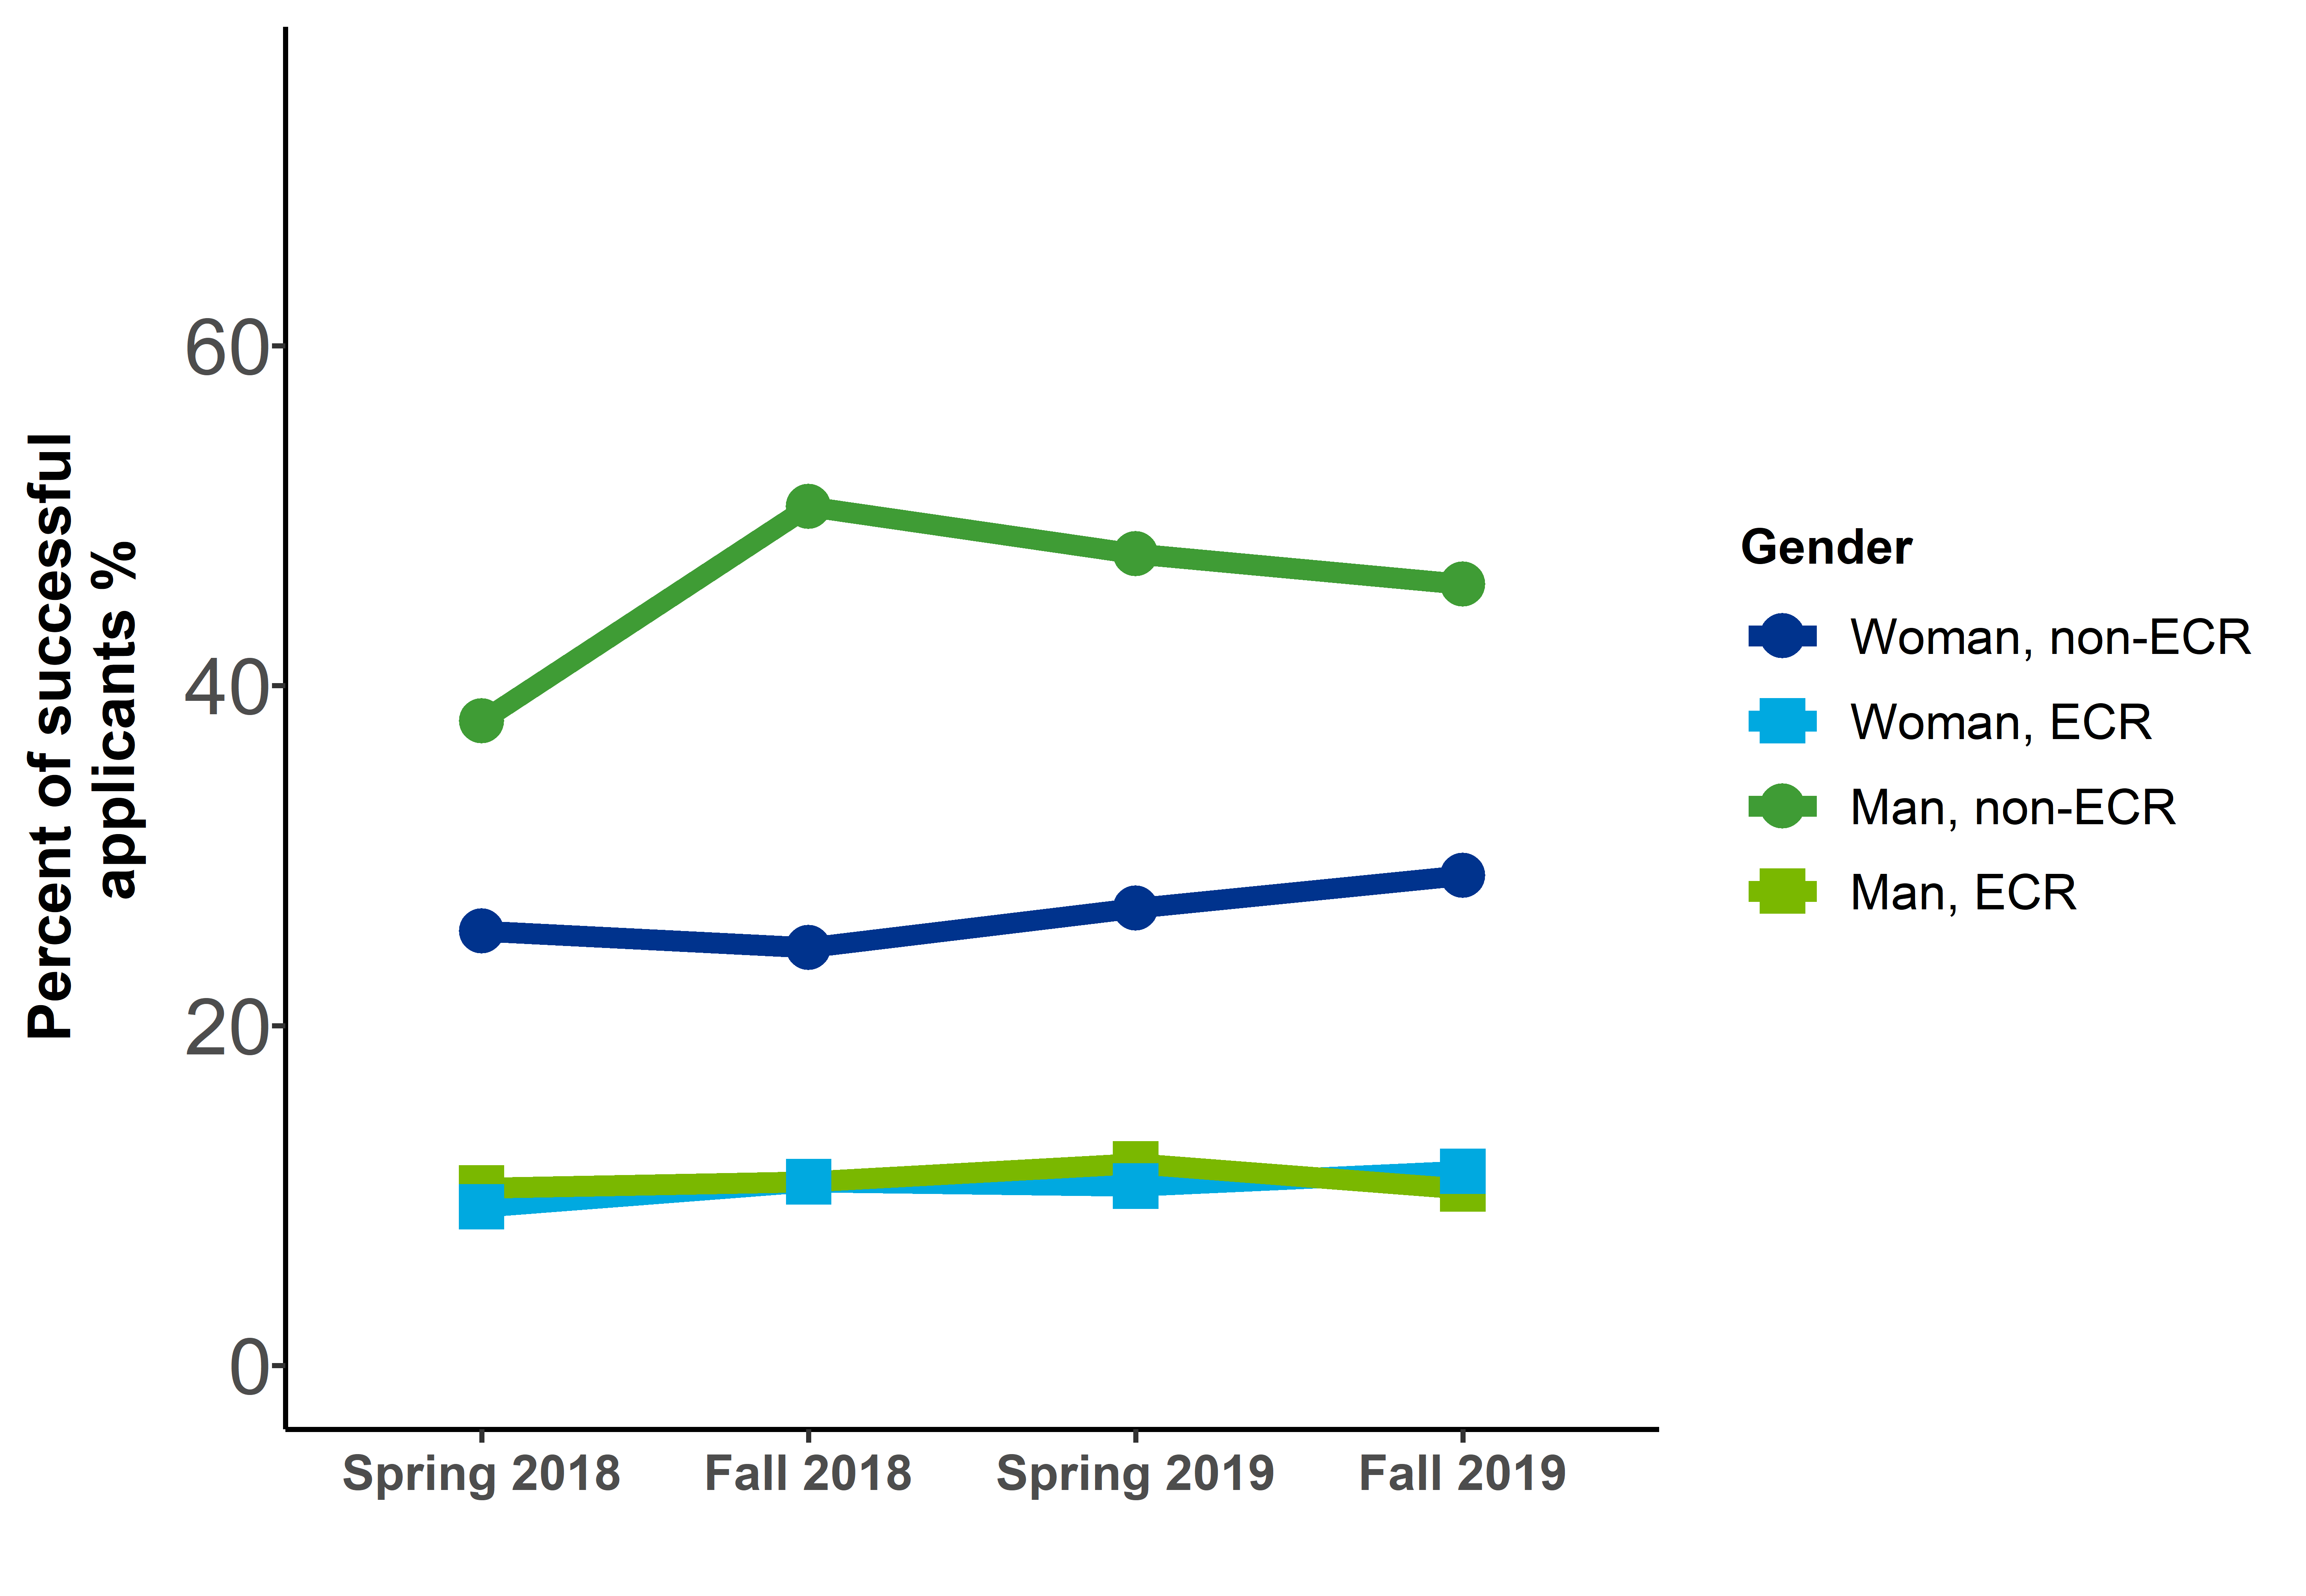
Figure 15 long description
| Response | Career stage | Spring 2018 | Fall 2018 | Spring 2019 | Fall 2019 |
|---|---|---|---|---|---|
| Woman | ECR | 9.3% | 10.8% | 10.6% | 11.4% |
| Woman | non-ECR | 25.5% | 24.6% | 26.9% | 28.8% |
| Man | ECR | 10.4% | 10.8% | 11.9% | 10.4% |
| Man | non-ECR | 37.9% | 50.5% | 47.8% | 46% |
| I prefer not to answer | ECR | <1% | <1% | <1% | <1% |
| I prefer not to answer | non-ECR | 2.7% | 2.7% | 2.6% | 3.4% |
Figure 16: Success rates by self-identified gender and career stage
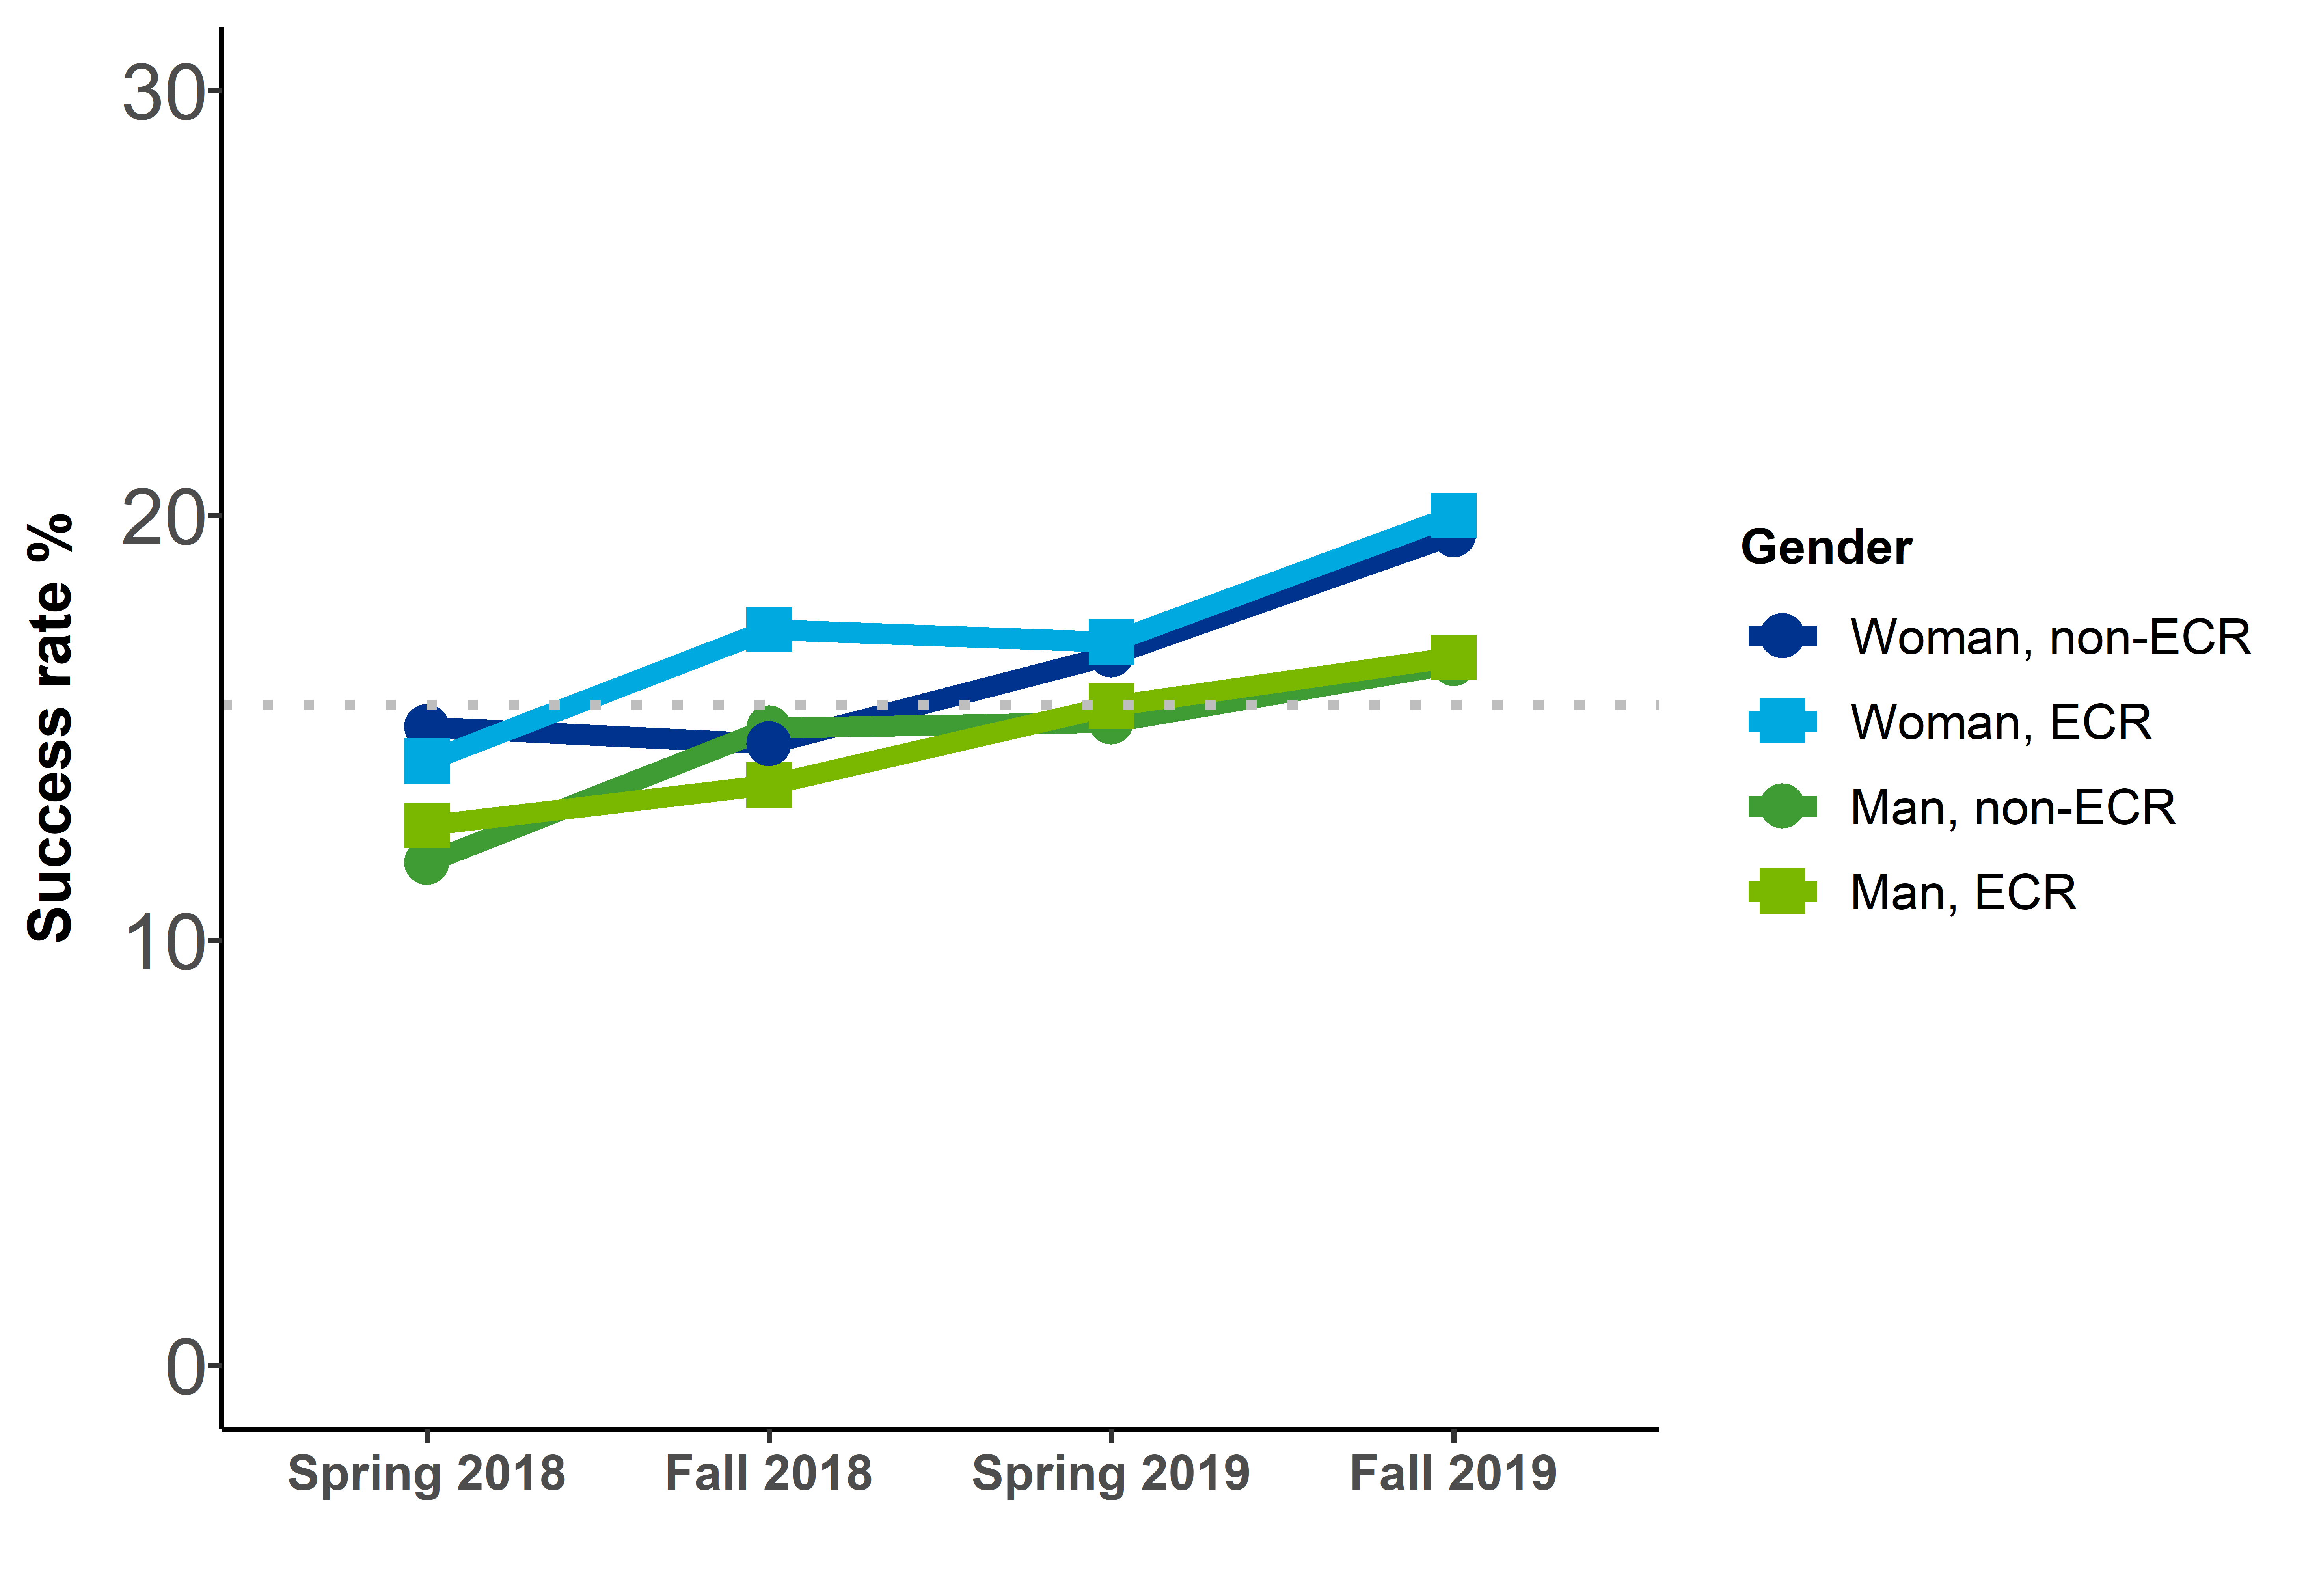
Grey dotted line represents the average success rates across these 4 competitions.
Figure 16 long description
| Response | Career stage | Spring 2018 | Fall 2018 | Spring 2019 | Fall 2019 |
|---|---|---|---|---|---|
| Woman | ECR | 14.2% | 17.3% | 17% | 20% |
| Woman | non-ECR | 15% | 14.6% | 16.7% | 19.5% |
| Man | ECR | 12.7% | 13.7% | 15.5% | 16.7% |
| Man | non-ECR | 11.8% | 15% | 15.1% | 16.5% |
| I prefer not to answer | ECR | 23.1% | 8% | low N | low N |
| I prefer not to answer | non-ECR | 11.6% | 15.6% | 14.1% | 21.7% |
- Date modified: